The Indicator Banks ACTUALLY Use - Full Guide to VWAP
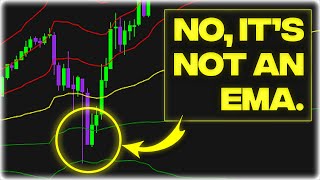
VWAP is the volume-weighted average price that banks use to execute large orders efficiently throughout the day. The bands around VWAP mark overbought and oversold zones where institutions optimize their fills, and traders can use them as entry points, targets, or support and resistance levels.
Chapters
What if I told you banks are jealous of you? I'm not joking. When you trade, you send an order to your broker, you get executed at the price you want, you place your stop loss, your take profit and you're done. But banks, hedge funds, and other big financial market participants, you know they don't have a couple thousand dollars in their account, even hundreds of thousands of dollars in their account. They have to trade billions every single day. And if they were to simply buy the market, they would move prices so much and gradually fill their orders at worse and worse prices. So the necessities that these market participants have is to fragment their order into many small orders and gradually and granularly put them into the market to get a better fill. If you take a heat map like the one I use and zoom in, you will often see perfectly cadenced small orders that are bought and sold in the market. And while it's okay for you as a day trader with five ES contracts to not care about this side of institutional trading called execution Alpha, where banks try to optimize their edge even in the filling of the orders, you still might want to know about it because it affects how the auction of these orders pushes price in every market up and down during the day and during the week. This table shows some types of order execution that you as an institution can implement. Price driven algorithms and volume driven algorithms. The first one, and the most common 1 is VWAP. VWAP stands for volume weighted average Price. It's basically a moving average that doesn't consider only price in its formula, but also includes trading volume. In this video, we will see how VWAP actually works. Why is it used by smart money and how you can integrate it in your trading strategy to potentially boost your edge and your profits and have an institutional dynamic reference as an extra confirmation for your day trades. So if you're not a complete financial illiterate, you might have heard of the Gaussian Bell, also known as normal distribution, which in statistics represents the normal distribution of elements in a sample. So let's say we're measuring the average height of people in the uk, we will have a very small percentage of very short people, a very small percentage of very tall people, but most people are going to be in the average part of the distributions. If we want to measure the average smartness of people in the uk, we will see that there is very few people with a low iq, very few people with a very high iq, and most of the people are going to be in the average. This central value is the average and then the area where most of the sample are going to be is called a standard deviation, also known as the 68 percentile. And if you take a look at normal volume profile as an example, you will see that it's basically a bell curve. What is highlighted, also known as the value area or the fair value area, is none other than a standard deviation. Trader at some point decided to put this at 70% to make things easier. So in volume analysis, the standard deviation is where most of the volume are traded. And this would be the average. Now, more or less. The same thing happens with the vwap. The V WAP first of all is an average. So we could consider it as this middle line over here. But it's not a static level, it's a dynamic level. It's a calculation constantly being updated which tells us the current volume weighted average of price. So this gives us a very objective view of what is discounted and what is a premium price. So everything that sits below the VWAP is discount related to the volume weighted average price of the session. So an objective view of what was the actual fair value in the market. What is the fair volume weighted price on average, throughout the whole session, whatever will be up here is going to be premium. You know, the concept of premium and discounts discussed by ICT is comparing to a swing high or a swing low, whatever sits below 50% or above 50%, this would be premium, this would be discount. But still it remains an arbitrary decision where to track this. And it's going to be measured in an impulse. This is a very simplistic view of discount and premiums. That's the reason why so many impulses don't retrace until 50%. But it's the market that decides what is premium and what is discounts. That's why sometime price keeps buying even when we are at the highs or even if we retrace just a little bit and we don't go down below 50% before buying again. So it is objective, but it's completely arbitrary to choose which impulse. We have a much more clear and objective indication of premium, discount and fair value inside of a session. That's why it's being used by institution and smart money and banks as a method of filling orders. And as you can see from this image, volume driven algorithms like VWAP, which are used to control the execution rate of big orders which are being fragmented throughout the session, are better suited for long duration orders like from 30 minutes to one day. So big orders are are mainly executed through the vwap. So as you can see, the market volume changes throughout the session. You have a big spike at market open, then less volume throughout the session. Then as much as we get closer to the close of the session, it's getting higher and higher on average. So the same thing will be done by the vwap. So in a trading floor, as an example, if the analyst department of a bank decided that we have to go long today, the head of trading will go into the trading floor and say, hey, we have to execute blah, blah, blah orders at the best possible price. A lot of times the reference for these trades as a discounted pricing or a discounted value will be whatever is is below the daily VWAP or the weekly vwap. Same. If the position is short, they will try to load most of the volume in the premium area. But of course, the best of the best to fill these orders is going to be exactly at the extreme of these lines which are going to be our standard deviations. This is going to be our discount standard deviation. This is going to be our first premium standard deviation. So these prices and these prices are going to be optimal prices to get all those little fragmented order being executed. Then you can have even wider ranges which are going to be the second standard deviation. So two standard deviations and a negative second standard deviation and so on and so forth. And the more prices go outside and reaches, for example, the higher bands, the higher the chance there will be some level of reversal. Same thing with the lower ones, because they're further away we will be from the dynamic fair value of the market. And the most likely we will be rebalancing. Of course this is not a law, this is just a dynamic reference, which is a much deeper reason to have an edge rather than normal Bollinger bands or moving averages. Let's see some examples. So these are my order flow charts. In my platform, I'm going to add volume by price values. Go to vwap. Developing vwap. Now let's zoom out. And as you can see, this line is being reset as soon as every single session starts again. So with every new session, this is being reset because it's a reference for the session. And as you can see, when we go further and further away from this average, we tend to trade back at it. When we break it, we tend to maybe retest it a couple of times before going down. Sometimes we just completely trade through it. But still is the dynamic value where most volume was traded during the session. So often it will give a reaction and act as support or resistance. So as you can see, price very often use this as a way of support or resistance as it is a dynamic institutional reference. After all this big sell off, we open a new session and once the fair value is established and the New York session open, look at the time right here. We test the vwap a couple times before pushing back up. Then once we're getting closer to the end of the session, we bounced back right on the vwap again here. Once it's been established, we bounced right back off of it a lot of times. Even here after the London session, in the New York session, we start feeling this vwap more and more as a form of resistance. So of course you might want to backtest it a lot and see for yourself the actual edge of the average. But the cool thing starts happening when we enable the bands. The first standard deviation is 1. The second here is 1.5 standard deviation. Usually I just keep it at 2, which is the third and even the third standard deviation. And as you can see as I apply that, it's giving me very, very precise levels where price is bouncing from. And the more we trade in the outer bands, the higher is the probability that at least we are going to see a bounce back to the fair value. Because market have been built to make trading easier for big operators. That's why the markets work as an auction and that's why they look for liquidity and they look for balance. And as you can see, once we break off and re break these levels, we have little bit of resistance in the first standard deviation, some more resistance in the second standard deviation. Testing the first one going back. But also there is moments with high momentum and once we've established a strong trend where still markets will keep buying even at higher and premium prices. So vwap is not always working. It's always needed to have a context behind your trading idea. You're not just going to trade based off of vwap only. So say you might have a long idea for your session. And as the New York session opens, we are still right on fair value. We start running up. You might want to wait until the price has gone at least to the first, if not the second standard deviation. We've accumulated a bunch of orders below here and created volume below and see the vwap going down a little bit also. And after we broke it and tested it, we can try our long trade. This can be one of the ways to use it. And you can use the second and third standard deviation as a target or if you're using reversal strategies, you might want to use these as some sort of overbought or oversold levels. Not just based on previous price, but based on the volume of the whole session and use the central vwap as a target for price rebalancing this overbought situation. As you can see, something similar happened here. We opened the session, we shorted the shit out of the market, we went down into the lowered standard deviations and here is where you want to look for a trade. This is the most convenient price in the whole session, or the most convenient value and price compared to the rest of the session. And as we see in this current session, we have been respecting these levels pretty greatly. Actually, we had a spike here. Back to the vwap. First band, second band and test. We don't close really above the vwap, but we test the first standard deviation, we run through all of them. At the last standard deviation, we run back up to the first one, pullback on the second one, back to the average before breaking it. We test the first one, go to the first one, test the average again on the second one, pierce through it, test again, test and again test over here. So as you can see, these levels are really felt by the market. Again, not because it's a magical indicator, but because it is an institutional reference and institution are the ones moving the market market. Try to back test a little bit with it in your trading strategy and see if it can be an edge booster. If it is, leave a comment and let me know if it helped. If you like this video, leave a like and a follow and I'll see you in the next one. Ciao.









