The ONE Liquidity Trading Pattern That Actually Works (Precise Entries)
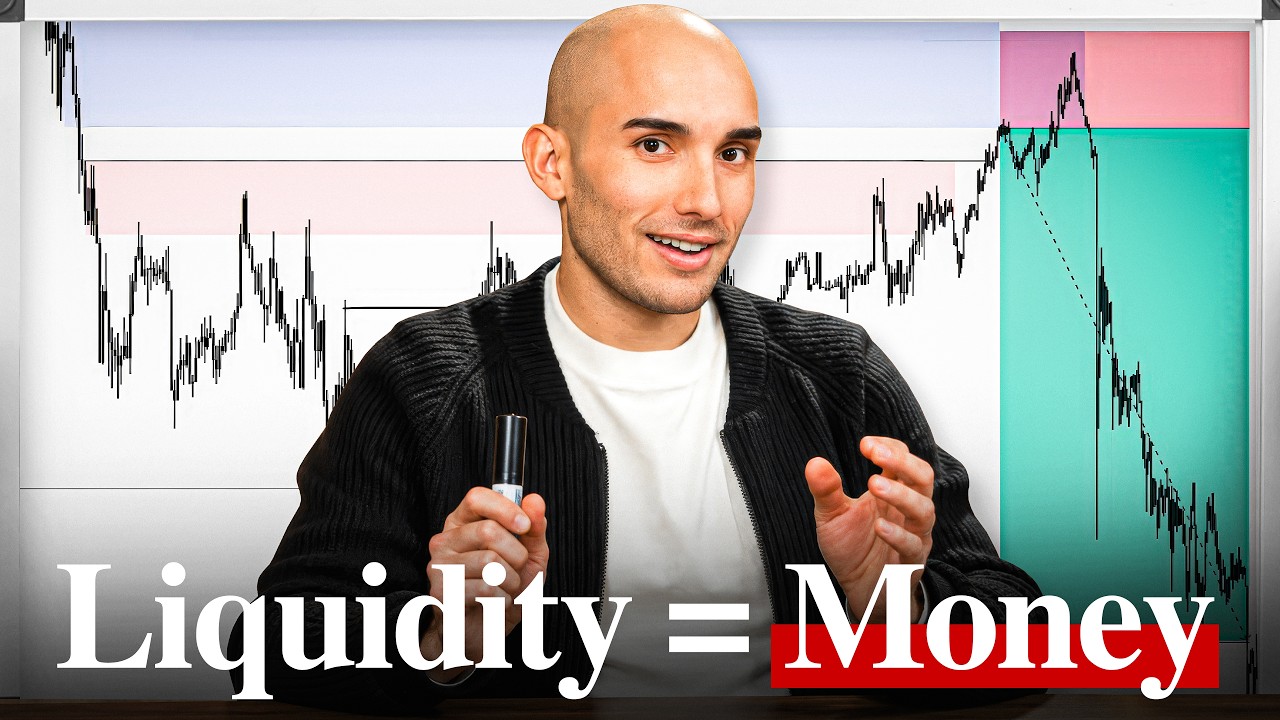
Marco Aceto explains his liquidity trading model for spotting precise entries at price highs and lows. He targets risk-reward ratios of 1:3.5 to 1:5, rolls stops to breakeven after taking the high, and holds most of the position to the next liquidity block. A recent USD/JPY trade netted $6,600 with potential for another $5,000 in partials.
Chapters
Last year I did over $100,000 in payouts whilst doing this.
If you end up applying this model correctly and waiting for the higher probable ones, the win rate is incredible to say the least. And that's when the RR can get stupid. You don't even need to look at the chart. The hardest part for people is literally just—
this guy is the world's best liquidity trap trader with over $500,000 in payouts and close to 800,000 views on his last Chart Fanatics episode.
If you don't see liquidity, you are the liquidity. I never like to predict where liquidity is going to be, highs or lows. I simply let the market communicate that to me. Again, what do I mean by that is understanding—
on this episode, he reveals his universal trading Da Vinci model. No matter if you trade gold or NASDAQ, S&P, or EUR/USD, this strategy works.
Here's your common retail mistake: low taken, high taken. There's their BOS. Where do they want to be buying from? Once you guys learn to cut these kind of trades out of your plan, you'll avoid a lot of losses. This is literally a Da Vinci happening on the higher time frames and then the Da Vinci happening on the lower time frames. This is like textbook stuff. Beautiful.
Not only does Marco go through it step by step, but he also trades live every week on Chart Fanatics Live.
Typically what happens is you'll just get a pullback and a continuation. Boom, trade invalidated. The novice trader or the amateur trader is going to think there's highs and lows all over my chart. What do I do, right? Am I going to sell above this, buy below this? It's best, in my opinion, to literally just—
Welcome back, everyone, to Chart Fanatics, the go-to channel for all of your very best strategy and concept breakdowns with some of the very best traders in the world. Today we actually have a returning guest. His last episode did 600,000 views and climbing to this day. One of the first people to trade live and do live trading segments on ChartFinex. He actually trades live on ChartFinex Live, and it's the one and only Marco Aceto.
Marfai, it's Johnny Marco Trades. I liked it. Thanks for the intro.
I just doxxed your name.
My full name is out there now. Yeah, but no, I appreciate it, bro. I'm excited to do this. Um, ever since you hit me up and said, let's do a part 2, I've been like, yo, let's do it. It's a good time.
Well, today we're going to go through the universal model that you specifically absolutely crush gold with. Uh, high risk reward, high win rate. But if I'm not mistaken, this works on any time frame and any asset.
Yeah, yeah, 100%. So this is going to be— we're going to be tapping into a model I call the Da Vinci model. Um, I kind of just threw a title on it just so when I ever I take trades on it, I just title it Da Vinci. Um, but yeah, like you said, all markets, uh, that's the beauty about this. And of course it is fractal to all time frames. That's something I preach about, is everything that happens on the higher time frames goes all the way down to the lower. So sometimes this model is literally playing out on the daily time frame, for example, and then sometimes it's playing out all the way down to the 1 minute. So the easy thing about it, um, to follow and grasp is again, it's, it's fractal from high to low, low to high, right?
And not only that, we're gonna go through it step by step, exactly how this presents itself, what to look for with chart examples as well of many, many trades that you've taken. And then just to top it off, we'll add in a live trading segment on top as well.
I love it. Yeah, yeah.
We'll tap into a lot of stuff. We got a lot coming. Also didn't wanna mention any people here that are new, we have the previous video that they should definitely watch cuz we cover the foundations of liquidity, how I view the market. Um, but again, it's important to watch that video in order to understand the model that we're gonna go through in this video. So I just wanted to mention that first so we can avoid as much confusion as possible. Mm-hmm.
We'll have that linked either on screen or in the description. So if you don't understand liquidity at its core, uh, then check that out. But this now is going into the specific entry and exit criteria that Marco uses. So where should we begin?
We're gonna try to make it a step-by-step process as much as possible. Um, but there is core and important, um, things I look for in order to apply this model. Um, so we're gonna start off at this guy here. So rough idea is first, again, if you guys are new here, you'll understand that I would view this high to have liquidity in the market. Okay? And then if the market sold off and let's just say we grabbed something from the left-hand side, AKA an old low, or we tapped into something, um, and now we wanna see bullish moves back up to the upside. Okay? And again, we have a target up here, this high. Now the model that I use, again, it's called the Da Vinci model. The important aspect of the Da Vinci model is you want to identify what I call engineered liquidity. So in other words, in this example, where's the bullish scenario? We want to see sellers enter the market.
Okay?
So what do I mean by that? So just to make this as easy as possible, we won't go into the full model yet, but we'll talk about this specific step that's very important.. So let me use the bed marker here. Once price comes up here and we start creating this high, again, understand that overall we wanna see price up to the upside. Okay? We have a level of liquidity. We want price to target. Now what's happening here is when we travel to the upside, okay? When we're coming into this level of liquidity again that we wanna see ran eventually, look how we are respecting it, printing this high. And then the market starts to retrace. Now, this is what I call— try and write as best as possible here— engineered liquidity.
Okay?
Again, in other words, it's just, um, in this bullish scenario, this is sellers entering the market here. Now, um, we spoke about it again in the previous episode, but just to touch on it, I never like to predict where liquidity is gonna be, highs or lows. I simply let the market communicate that to me. So again, what do I mean by that? Very important. This high here, respecting highs to the left-hand side. This is the market telling me that we are building liquidity. And let's even just put a little dollar sign up here. We are building liquidity, okay? Orders above this high up here. Once we engineer liquidity, okay? So then typically what happens, sellers enter up here., and the market will retrace. Now typically I want to be buying down here. Okay? So entry would be down here. We're gonna tap into all this in depth. My entry would be here and then we're, we're gonna look for that move back up to the upside. But the first and the most important step to this model is understanding engineered liquidity. And this is this right here. Okay? So again, this is a bullish scenario. You guys can literally just invert this and flip it to look at a bearish scenario. But again, the most important part to this model, if you don't see engineered liquidity, it's not a Da Vinci model. Okay.
So that just says, well, the power of this model and the whole concept as a whole is this is what will stop people getting stopped out unnecessarily, getting caught in the wrong side of the market and almost the market tricking them to a degree because you can identify now engineered liquidity and identify what the market's actually trying to do.
Yeah, exactly. And like I was talking about before, we're simply— we're not actually not even predicting what highs and lows need to go. We're letting the market literally— excuse me— we're letting the market communicate to us by printing this high up here, this engineered liquidity high. We're letting the market communicate to us that we are going to go back higher, but the sellers literally are going to enter here, build that liquidity, give that reason, that logic for price to move higher. And then again, we're going to look for those entries. Down here.
And then when it comes to entry, no doubt we're going to go step by step into it, but just at this point, are we entering directly from here, or are you going to look for something further?
Yeah, so there's a couple— we're going to dive into entries on the whiteboard, we'll talk about it more so you guys understand, and then of course in the charts. But there's multiple ways on taking this entry. Again, the most important step, and I need you guys to just understand this as a whole before we move forward, is this engine here, the Quidli Point. Seeing this reaction occur is the most important part. Once we engineer liquidity, now the model is active and you can start looking for entries right back to the upside.
And would you say because of the way the model's presented and that engineered liquidity, is that what creates such a high risk to reward and high win rate?
Yeah, yeah, of course. So the thing is, a lot of people, let's just say for example, people are buying in this leg all the way to the upside, wherever, and like, let's just say this is a higher timeframe. People are looking for lower time entries on this bullish leg. From low to high. Now what happens is they want to see price back up to these highs. So price will come up and then it respects and engineers and then comes back and takes them all out, right? Anybody that was buying here, they're taken out. Anybody that was buying here, they're taken out. And then it'll take them all out and then it'll move bullish. So yes, the, the beauty about this model is when it comes to the extreme, the risk to reward is just ridiculous sometimes. I'm talking like 1 to 10 plus. Now does this happen? We have to be realistic. Does this happen all the time? It doesn't happen all the time. But however, these are, this is the reality of the model and they do come along. Sometimes they'll come along a couple times in a week, sometimes once or twice in a month, right? You just gotta take it for what it is.
And that's what, in regards to that, that's the high risk to reward, you know, the bigger trades you're talking about. But this model presents itself very frequently, right? On a day-to-day basis.
Yeah, yeah, 100%. Like I said, it starts from the higher timeframes, it's fractal to the lower. So, you see this timeframe, or sorry, you see this model playing out on the higher, and then if you go down to the lower timeframes, of course you, you could see maybe the model coming a couple times per day, right? If you have a couple different assets on the list. Okay, so now we'll talk about, um, how to basically take advantage of the model and actually enter the market, right? So again, um, and you know what, we'll actually touch on an extreme example to show you guys the the high RR that can come along with this system. Okay, so, um, let's just draw it up like this. Okay, so just like this piece of price action we've talked about, on the flip side, right, we have highs intact up here, level of liquidity. Now it's going to start happening down here at the lows. So high is taken, this low respecting this low, and boom, we have built liquidity once— sorry, wait, once we move away, boom, now we built liquidity. So now you have liquidity below this low. So if you guys literally just look at it again, if you just invert it, look at the top, it's the exact same. You can call it a pattern. It's the exact same logic, just on the flip side. This is a bullish level of liquidity and you have sellers up there. Okay? So it's just the same on the flip side. Now price moves up to the upside and remember we come up to the highs and this is where we view sellers to be entering the market. You want to see engineered liquidity. So What happens is we print this. Let's just keep it black for now. As we come up and we go bearish. Okay, so again, this would be your engineered liquidity. Okay, that high right there. And we can also just draw it on like this. We can say sellers are entering from an area on the left-hand side. Okay. And again, if you guys aren't new here, previous video, this would just be a POI of some sort for retail, an order block, whatever it is. All we can understand is though this high here has been respecting highs on the left-hand side. So it is engineering liquidity.
Okay.
The first step to the model, basically you want to see the engineered liquidity. Now the model's active and we want to start looking for entries. Now you're going to ask me, okay, Marco, we understand that engineered liquidity. How do we take advantage? How do we actually enter the market, right? And target these highs.
Trading education is completely broken.
For years, the industry has been purged and poisoned by bad actors, fake results, and strategies hidden behind paywalls. But in every industry, every once in a while becomes a catalyst, a moment in time for change. Now imagine a world where elite trading education was entirely free. Education with no hidden agenda, verified trading results, and real profitable strategies, all for free. Welcome to Chart Academy. Chart Academy is the world's first all-in-one platform for trading education. Chart Academy is free. No catch, no upsells, no strings attached. World-class trading education completely free. Hi, my name's Randy Howell, and welcome to My Chart Academy Masterclass.
This is completely revolutionary. The biggest change in trader education in 20 years.
My name is Carmine Rosato. I'm a verified 7-figure trader. I've been trading for 10 years now. The reason why a lot of traders fail is because they— Ultimately, this work is about self-mastery.
Trading education will never be the same again.
Browse hundreds of hours of content in forex, futures, stock, options, and crypto from the best verified traders on the planet, all in one platform. Experience a completely personalized trading plan tailored to you and your goals. Reach milestones, redeem points, and earn rewards with a massive global community. Whether you trade Forex, Futures, Stock, Options, or Crypto, Chart Academy has something for you. Join the waitlist now and be part of a movement that is going to change trading education forever.
Now look what I've drawn on down here at the low. We have high, low, high, low, and we move bullish to the upside, okay, leaving a level of liquidity to the downside. Now what happens is typically uninformed traders— and let me just, uh, hopefully we can fit this here— people will start looking for buys down here, okay? Look, you have high taken,. So any retail traders trading off structure, Fibonacci, whatever it is, usually will be entering in some sort of areas in here. Okay? They want to be taking buys, but we understand we want to buy below lows, sell above highs. We want to see price. Typically what happens is you get a little false reaction and then price comes down to the low. Boom. As soon as, and this is very important right here, guys. Um, a lot of people like to kind of, and I call it overrefine, and look for an imbalance in this low. In my opinion, unnecessary. This is providing you in a very high RR already. You don't need to overrefine because typically when people overrefine, you're going to start missing entries. So to keep it as easy as possible, and that's— I preach this on a daily basis— to keep this as easy as possible, once this low right here is taken where the liquidity is, you enter your buy position. So buy will basically be right there. So that's where we are entering a buy position. Typically what happens afterwards, of course, is the price will move all the way to the upside.
Okay. So like with this concept, there's multiple levels to it, right? So when once this has been swept, yes, to the low, essentially this brings in your sales, Yeah. So then people are gonna be entering sells all along here. It's already taken out buyers at this point.
Yeah.
'Cause it's taken a significant load to the left.
Yeah. That's trading below an old low to the left.
So it's already taken out the buyers from that position, if you will. This then entices the sellers. This then, uh, also entices some buying here.
Yep.
Right. And then when we get to here, more sellers still stacked. So then we're having this reaction and stacks even more here.
Yep.
Price then comes back down again. To your point, there'll be buyers trying to buy because of this structure. Yep. And then once price reacts and breaks that low, more sellers probably here, more sellers trying to sell here.
Yep.
When in reality, at this point, all buyers have been taken out and all that's left is the highs.
Exactly. Exactly. So the, the artist.— and I don't even want to say hard, hardest part, because people need patience in every single strategy, in every single system out there. But the, the variable that people struggle with the most is just waiting for the setup to occur, right? Waiting for these lows down here to get taken, because per the model, per the Da Vinci model, remember, this can provide— if you wait and you stay patient, this could provide you ridiculous RR and a ridiculous win rate sometimes. So if you just learn how to wait you learn how to trust the level of liquidity here. Once that low was taken right there, that is your entry. And just to make this as easy, again, entry here and stop loss is gonna be below this low. So this is your stop loss down here. Your stop loss is gonna cover this low from the left-hand side. So look, entry, stop loss, very tight risk. And look at the gain on the table. Um, if we can just use the blue, you have from entry all the way up to target, which would be this high. Think about it, where is the liquidity? Ask yourself. You have this high respecting all these highs from the left-hand side. You want to be targeting that liquidity, right? Because let's just say we do end up moving bearish, we shouldn't move bearish until this high is taken, right? And again, you have all of this gain on the table for— look how much risk, very small, very small risk.
I would say this is the most simple way of trading and understanding what's going on behind the candles and the general positioning within the market without having to get really complex with order flow, right? I'm sure order flow could give some more insights, but then equally there comes that— it's really interesting when it comes to complexity because people say that, you know, once you understand order flow, it's not as complex, actually very simple. Uh, but this is a really amazing way of— you're, you're taking that concept basically, but presenting it using the candlesticks. And really, you're just— I know people might not like to hear it, but this is really just trading using one line, right?
That is, it's just horizontal lines, right? And it's literally letting price communicate to us where liquidity is, right? So everybody— and we talked about this briefly in the first episode— there's a lot of people out there like to say there's liquidity above every high and low, right? Right then and there, the novice trader or the amateur trader is going to think, there's highs and lows all over my chart. What do I do? Right? Am I going to sell above this, buy below this? It's best, in my opinion, to literally just let the market communicate to you where the liquidity is. And that's what I mean by this point right here. This is the market communicating to you that we can— we now have liquidity above these highs. Once we engineer liquidity, the first step to the Da Vinci model.
Mm-hmm. And in regards to this, what's very, very interesting is, you know, when people hear high reward to risk potential, and you can see very clearly why that's the case, 'cause you're getting such an optimum entry with an invalidation not far away, uh, with such upside potential in terms of where you're targeted. What's incredible is a lot of people when it comes to prop firms, they're always like, oh, you know, our risk 2%, 3%, pass fast. Get big payouts. But with this model, you could choose to do that, right? And run the risk that you have with prop firms in terms of like gambling and overdoing it. But instead, with this model, you could risk 0.5% to 0.75% and still make $10,000, $20,000 in payouts because of the asymmetric setup when it comes to the reward to risk. Now, what's the reality though with that in terms of very briefly, when it comes to the entry, do you have rules around, let's say if it doesn't work out, you know, we're not sitting here saying this is 100% strike rate, right? So when it doesn't work out, do you have rules around, you know, if it's maybe messing around the entry or it ends up obviously invalidating the setup? Like what sort of rules do you have in place of maybe max tries or what does that actually look like when it comes to, you know, executing this?
So, okay, from a risk perspective, I always have, and everybody's different, I have a specific amount, a specific figure I'm willing to risk on a daily basis, of course. Now from a technical perspective, yeah, let's just say for example, and listen, like Chris says, nothing's 100% out there. There's going to be times the setup is invalidated. But I'm telling you actually, if you end up applying this model correctly and waiting for the higher probable ones, the win rate on this specific model is, it's incredible to say the least.
Futures traders, it's time to hear about Apex Trader Funding, the largest futures firm in the industry. They have completely changed the game with their new evaluations. So far, they've already paid out over $600 million to traders around the world, just like me and you. And not only that, Apex actually holds the record for the largest payout to traders, which is of course with JadeCap, no stranger to Chart Fanatics, with $2.5 million in a single payout.
And the person before that was Trader Kane with $2 million.
In payouts.
Now, what sets Apex apart?
Apex, you can get up to 20 accounts, which no other firm offers. Now, not only that, they have extremely clear rules. With their revamp, there's no MAE rule, no 5:1 risk to reward rule, no hidden rules, no gray areas, clearly defined drawdown models. So you have two options now: end of day drawdown and intraday. Trailing drawdown, which means no payout denials, no payout reviews, no discretionary decisions, and no surprises. What sets them apart as well? Traders receive 100% of approved payout requests, up to 20 accounts, as I mentioned, and one day to pass. Now, the other thing that I love about Apex is not only can you get 20 accounts, but there's different account sizes.
So they have $20K accounts all the way to $150K accounts.
So you can get 20 of any of the account sizes that you choose. Not only that, you have various trading platforms from WealthCharts to Tradovate to Ribmic. The choice is yours. So make sure you use the code CF to get up to 90% off on evaluations right now using the link in the description below. Trade at Apex today.
Let's get back to the episode.
And don't take my word for it. Study the model and go look at the charts and you guys will see exactly what I mean. However, going back to like an invalidation kind of look, let's just say price comes down and sweeps out this low, then I need to wait for something like this to occur again. I need to see early buyers induce in the market. I need to see those early buyers taken out and then I will look for my entry again. And the reason why I'm saying that is because we still have liquidity to the upside, meaning, okay, maybe we were early, that's fine, but it does not mean the direction and the bias The idea is incorrect.
And just to be clear as well, this entire model would just be flipped upside down for a short.
Oh, 100%. Yeah. This, this exact model right here would literally just be inverted. Um, yeah, yeah. There's going to be, we're going to look at bearish examples as well, just to train the eyes as much as possible. But yeah, nothing changes. That's the beauty of this model is sometimes like, and you know what, there's, there's a perfect example. We're going to go through in the charts afterwards.. But sometimes I'll have like a DaVinci model on the higher timeframes that's providing me my direction, providing me my bias. And then I'll have a DaVinci model playing out on the lower timeframes, providing me my entry. And that's why I feel like this model is like so simple but so powerful because it, it can provide me my direction, but it can also provide me my entry, right? Higher timeframes down to lower timeframes. And that's when the RR can get stupid.
Okay.
I don't wanna spit out stupid numbers, but like I said, don't take my word for it. Go look at the charts afterwards. You guys will see exactly what I mean.
And wait, you're going to be trading live later as well, so they will see it live as well. Just before we move on and start breaking down step by step with the charts as well, is, you know, we know it's fractal, so it doesn't mean higher timeframe to lower timeframe, but generally for what you do, what timeframe are you sort of operating this on?
Great question. Typically, I trade both markets, futures and forex or CFD, whatever you want to call it. Typically CFD, I'm holding trades long-term 'cause you're able to do that, right? Over the course of a couple days, maybe even a week's time. However, in the futures market, you gotta close before market close. So let's just use the futures market for example. Typically we'll be looking at, um, a model to take an entry off the 1-minute, 5-minute. So be really deep into the lower timeframes and then targeting those, I would say mid-higher timeframes, you can call it 15-minute, 1-hour levels. Um, and then of course you use CFDs where you can hold the trade to these higher timeframe targets without the restriction of closing early because of time. Sometimes I could have a, a Da Vinci model playing out on the daily timeframe that takes days to play out. Right. But yeah, I'd be taking the entry sometimes. There's been times, I think we can even cover an example that I was taking entries off the 1-hour, the 4-hour still with like a 1:10 RR. Again, that's, that's the beauty of CFDs. You can hold it. Right.
Yeah.
Cool.
Uh, so should we start breaking down in steps then? Yeah.
So, okay, let's, uh, let's clear up the board. Okay. So now we'll draw out, um, the Da Vinci model on a bearish scenario, right? So I always draw the bullish ones. Now I gotta think about, right?
Okay.
So we have a level of liquidity to the downside. Now price ended up moving bullish and taking out an old high from the left, wherever that is. Let's just say there's something over there. So we take an old high from the left-hand side. Now you want to be looking for entries to the downside. Okay. Now, just like we spoke about before, typically what will happen is you have a level of liquidity built for us here, right? Low taken. You have a high approaching previous highs. And then it sells off to the downside.
When it comes to that being a level of liquidity for us, is there a specific reasoning behind that versus say here or that versus say here?
Typically again, it's the pattern of waiting for a high to respect a previous high or in the flip side, a low respecting the low. So if I could, you don't want to screw yourself over and think about it from a pattern perspective, meaning, okay, there's a high left. Now you want to wait for price to come above and sell here right away. Now you gotta ask yourself, why are you selling above that high, right? You wanna make sure there is liquidity above this high before selling. 'Cause typically what happens is you'll just get a pullback and a continuation. Boom, trade invalidated. So you need to make sure, again, wait for the market to communicate to you that there's liquidity above this high. So we have the market again running, trading above an old high to the left-hand side. We get a reaction down, then the market starts printing internal, I would call it. Okay, high respecting high. Okay, again, I just said internal. I don't want you guys to get too spunked by that. It's very simple. You have a high respecting previous high and we sold off. Okay, now coming back down to the downside. All right, we're going to talk about this again, just like you were on the bullish example. Now will be a bearish. So Price is coming down to a level of liquidity we've already identified, right? We want to see price trade below these lows eventually, aka we want to sell into them, right? Now typically what happens is you have buyers looking for entries in this area, okay? And all of a sudden you're sitting there and you see the market react, okay? Now I hope you guys are all starting to see what I'm talking about here. This is going to be now known as our Engineered liquidity. Okay, you have this low respecting liquidity from the left-hand side, respecting previous lows, and moving away, telling us we are engineering liquidity right here. Again, first, you can say it's first step, I guess the first, first step. This will make more sense if you get— if you watch the previous episode— is making sure we're running something from the left-hand side. That's what actually validates us looking for the sell, of course. So I guess you could say first step, taking out something from the left-hand side. Okay. In this example, a high.
Mm-hmm.
Now the bearish setup is, is basically valid for us. We want to look for those sells. Now the next step is you want to see the market sell off to the downside, maybe induce some early sellers. Perfect. And then here's the engineered liquidity. Again, no engineered liquidity, no model. If we have engineered liquidity, then the model is active.
Mm-hmm.
Okay, so from this point, we trade above the high, we sell off to the downside, we, we create an internal liquidity point, price continues selling off, and we engineer. Then you have the move back up, boom, high is taken out. And then lo and behold, just like we spoke about it on the, uh, bullish example, got a lot of markers here, entry. Okay, and Stop loss.
Okay.
And then that's when you get to capitalize on this whole move to the downside.
Target targets here, right?
Exactly. And we're gonna be targeting the liquidity left at this low.
And then once that is taken, does, you know, obviously it depends on the setup, depends on everything, uh, going on in the markets, but general premise-wise, once that's taken, does that then open up potentially this to then be the next target?
Yes, of course. Let's just say for an example here, we were overall on a, on a bigger perspective, we were bullish.
Okay.
And this was essentially what I would call a counter-bias sell, short-term sell. Yes. Then yeah, you could typically look for a buy after this low is taken. But I need everybody to understand here, and this is something I preach on a daily basis, even on Tarfanatics Live, is we're not, I'm not a pattern-based trader. Meaning if you guys see this model playing out, you're not automatically buying below the lows. In this example, you need to make sure you always have a reason, a logic for price to move to the upside. Is there highs intact, right? Maybe in the past over here, whatever it is, is there highs intact? Is there a reason for price to run back up to the upside?
Got you.
All right, so yeah, if we are bullish overall, just to answer your question simply, yeah, of course, maybe there could be a, a buy scenario below these lows.
Cool. Should we go through it now step by step on the charts?
Yeah, of course, let's do it.
36 seconds. That's Hola Prime's fastest payout on record. Not 36 hours, not 36 minutes, 36 seconds. The average payout time across the entire firm is 34 minutes, and 98% of their payouts clear in under an hour, which has been verified by Deloitte. That's exactly why they just won fastest payout prop firm at the UF Awards. Most firms make you wait weeks, and you still have to pray and see if you'll get it. Hola Prime HOLA Prime CFDs pays you before your coffee gets cold. And that's why you should trade with HOLA Prime for your CFD accounts today. You can get a massive 30% off using the code CF at checkout. So make sure you go check them out with the link in the description below. And let's get back to the episode.
So we're going to be hopping in on gold. And actually, funnily enough, as we're recording this, record highs on gold. I think we hit over $5,500. So it's funny, we're going to go over gold. And to be honest with you guys, Gold actually is my favorite asset to trade. Unfortunately, we're sitting in, in times right now where it's at $5,500 and it's just rocketing to the upside. And I'm not trying to buy that high and I'm not trying to sell the top, right? So I'm simply waiting right now. However, still setups to be looked at from relatively new price action. And let's look right at this example right in front of us. So first of all, what we're going to identify here is these highs. Okay, now from this point you can see how we printed this high and we sold off to the downside. Okay, that's very important. And that's what we were just talking about, the whiteboard. Okay, that would be again, probably what you could call the first step to this model, right? Because in order for us to look for buys, we need to of course be taking something out from the left-hand side. So there's that old low that we were talking about. Okay, perfect. From there you can see we get a short-term pullback and then sell off again. Okay, now Bear with me here because this is actually market open, so the price action looks a bit iffy, but nonetheless, we're going to go through this and make it as pretty as possible. Okay, right away, I hope you guys can all see why I grabbed this high from the left-hand side. Okay, look how we've had this point here and this point here respect previous highs. Okay, so again, this goes back to what I was talking about, how I'm not guessing where liquidity is, right? I'm not saying there's liquidity above every high or below every low. No, I'm literally, I'm literally letting the market communicate to me that there is liquidity above these highs. What do I mean by that? This example right here, we have these two swing points, these two highs respecting this high from the left-hand side.
Okay.
It's very easy from that point we sell off. Okay. Again, we grab old lows. Perfect. From there, price trades back up to the upside. Okay., and you can see this was an old low left actually right at market open. Price comes back and sweeps it. Okay. Now if you guys, again, I hope you, hopefully you watched our first episode of Chart Fanatics. You guys would understand that this would now be a low I would view not to have liquidity. Okay. What do I mean by that? It has simply swept out previous lows. You can say this low here and also lows over here, and then we've went bullish. Okay. So it's a, it's a low again, I view to have no liquidity. Which is important for me. Okay. Now getting towards the most important part of the model, of the DaVinci model, and that's again, identifying, um, the engineered liquidity. And hopefully you guys are starting to see this on your own. That's the goal here. We're trying to train the eyes as much as possible, but you can see how these highs on the left-hand side, look at this equal highs. Okay. And of course, just to make this as easy as possible, we can actually just grab all of this, right? We, we've already identified that these highs are gonna be a future target for us. Okay, now look what price does here. Very important. We have this high, we have this high respecting this whole liquidity zone. These highs we've already identified as a future target. Again, very important. So what we can do is we can literally just mark this on as our engineered liquidity. Okay? Just like we were talking about on the, on the, um, on the whiteboard. Very important. Coincidentally, look on the flip side, we have left internal lows right here. Now, why did I mark out this low? Same thing. We have this high in taken out, price goes bearish, respects this lows, and again goes bearish again. Low gone bullish, respecting previous lows. I'm not predicting where price needs to run to. I'm letting the market communicate to me where price needs to run to. I grab out these lows and drag them across.
Okay.
So there you go. We have engineered liquidity, AKA more sellers entering the market here, which we are going to target. And then we move to the downside. We grab internal. Perfect. Now, how do we enter? How do we participate, participate in this move? We need to identify this whole scenario again, basically on the lower timeframes. Okay. So sometimes what occurs is you would take an entry here on the run of liquidity, just like we spoke about in the diagram with our stop below this low. Now in this example, we had a big, what I, I call a liquidity block, a low that doesn't hold any liquidity. So the stop loss is too big. When the stop loss is too big, the RR is shot in my opinion, and I just don't take those trades. So what I need to do is just wait for the lower timeframe to develop an entry for me.
So in this particular example, to, to your point there, you have, oh, a nice smooth view with the, uh, with the mouse. But, um, the reason you mentioned that RR being short is 'cause generally you're mainly focused on targeting here, right?
Yes.
Which, you know, to some people, 1 to 1.7 is, is great. But just with this, uh, asset class and how it's been, even this trade would present relatively a low risk to a high reward. That's outside the model in terms of target-wise. Of course, yeah. Even if you were to trail, even if you were to leave a runner, fair in this market, it could work out quite well. But to your point, obviously following the model with the rules as we want to, you know, as you said, this one in particular has a larger stop. So some people might be okay with that, but what do you do then otherwise if you want to still take advantage of this? Yeah.
And that's a great point. Everyone's different at the end of the day. Some people are comfortable taking a lower RR, which to each their own. I always say that for myself, I understand that I perform the best. I make the best, the most money when my RR is minimum 1:3 minimum. And again, that's just found what I've worked. Again, everybody's different, right? 1:1.7 works for you. Hey, go ahead. But for myself, I do want to see a higher RR on the table. Now, what do I do? I need to identify a confirmation-based entry on the lower timeframes. Okay, so we're going to dive into this price action right here. Okay, so now we're on the 1-minute chart, um, and something I do want to speak about quick is I know there's a lot of stigma about the 1-minute chart. I'm not, not actually on the 1-minute chart a whole lot, only typically in futures, but this given example here on gold, yes, the 1-minute timeframe did provide the entry. But I don't want you guys to sit here being scared of the 1-minute timeframe. Sometimes it will provide entries, sometimes it doesn't. It's just you take it for what it is. In this example, yes, the 1-minute did provide us entry. So we're going to talk about this. We grabbed the lows and this is literally a Da Vinci happening on the higher timeframes and then the Da Vinci happening on the lower timeframes. This is like textbook stuff.
Beautiful.
So again, we run an old low from the left. We are bullish. We want to see price to the upside. Okay. And remember the next step is we want to identify early buyers. Look, low ran.
Okay.
Now look at this price action is very, very choppy PA on the way to the upside.
Mm-hmm.
Okay. We have all of this liquidity to the left.
Okay.
And not only this is just lower timeframes. Bear in mind, don't forget the higher, right? Remember this engineered liquidity up here?
Yep.
So any bearish reactions deem them to be false is what I call it. And just short-lived, just pullbacks. Okay, so what happens here, and I'm going to mark this on— what I usually do is I mark it on as a red box, not an area I'd be trading from. This is me understanding, and hope you guys are seeing this, that if we react here, this is now known as engineered liquidity. Okay, so again, now there's a Da Vinci forming in front of us on the lower time frames. Okay, how do we get involved? Remember, this low, deem it to not have liquidity. Okay, this price action All of this. Okay. If you guys are good, I can't go any lower than the 1-minute timeframe, but if you understand this price action, it is simply just this. It's all it's doing, right? You can call it a channel, you can call it structure, whatever it is, it's building liquidity. Now, how do I enter the market? You can see from here, this level was respected, which means there's going to be liquidity below here. And watch this. We run that last level of liquidity, okay? Not just this low, not just this low, not this one, not this one, not this one. If you trail your eyes all the way to the extreme, it's going to be this low down here. And remember, we view this one, this last wick here, this last area, to not hold liquidity, okay? And this is just showing you guys the beauty of high— how high the RR can be. Sometimes you have your entry as soon as the low gets stabbed, okay? Nothing else. As soon as it gets stabbed Stop loss goes below the low, and of course this is gonna be on a CFD chart. Let's give it a little bit of breathing room.
Okay?
Stop loss goes below. This is with breathing room. Bear that in mind. And the target to the upside, you're looking at a 1:12. And if I just zoom out, there you go.
Okay?
And again, the beauty of this model is it happens on the higher timeframe.
Okay?
Look, Higher timeframe for direction, and then it happens again on the lower timeframe for entry. Okay.
And that was in a space of a few hours as well. It's not even a—
yeah, I mean, look, if you had an entry right here at 10:00 AM exactly, and target was hit in the afternoon, this is Eastern, um, EST. Uh, so you're looking at 2, 5 hours and a possible 1 to 12 opportunity.
Okay.
But like, just let's zoom in on the entry where we chose our liquidity point just to really highlight it. 'Cause I know we did it clearly on the whiteboard, but this is the beauty of what we try and do here is show the picture perfect on the whiteboard, but then the reality. So it's good for us to now see the reality of, you know, trying to, as you said, train the eyes, you know, especially on the lower timeframes. So let's just like really zoom in on this entry point. Just, uh, 100% be, uh, extra, extra for that.
So yeah, this is the 1-minute time frame. So again, I can't open it up any lower than this. When we go into other examples, you guys will see, um, this is just the nature of price action. Sometimes it, it gets— I'm not going to go into the seconds time frame. However, if you guys are looking at this chart in front of us right now, you can see that we have a low printed, we move bullish, okay? Price ends up coming back and respecting this red box. So again, all that is right here is literally just that. High taken, low respected. Very simple. It's all fractal all the way down to the 5-second if you want. Unnecessary, but you guys know what I'm getting at. And then after that, high taken, low respecting low. So liquidity, right? And then we move bullish, take out a high, low respecting low. So I hope you guys are starting to see where I'm coming from, right? High taken, low respecting low. High ticket, low respecting low. So it's just, guys, all of this is a buildup, right?
I've got to tell you something. Hundreds of thousands of traders have already made the switch to TradeZilla. And the biggest reason? The AI. TradeZilla is the all-in-one platform built to turn you into a profitable trader. And at the center of it is an AI copilot that does the heavy lifting for you. It watches every session. It learns exactly how you trade and your strengths and your weaknesses, the patterns you keep repeating without even knowing it. And it tells you in plain language what's working and what needs to change. The moment you close a trade, your AI captures it automatically, fully synced to your broker or prop firm. Zero manual entry. You can replay any trade tick by tick, pip by pip to see the full picture. Backtest your strategy on years of real data before you ever put up real money behind it. Your AI copilot ties all of it together, surfacing insights you'd never find on your own and guiding every decision you make going forward. Hundreds of thousands of traders, one AI-powered platform, real lasting results. Now, if you want that AI copilot and see your trading excel, the link for TradeZilla is in the description below. Use the code CF20 for 20% off your year RELEASE subscription, or CF10 for 10% off your monthly subscription. Let's get back to the episode.
And you know what, um, everybody's comfortable with whatever it is. So what do I mean by that? Do you need the absolute extreme? Check this out. Even if you grab this low, for example, okay, remember the stop loss is the most important part. You need to make sure your stop loss covers here. Don't get greedy. Even if you didn't take the lowest point, look at the RR still. You are still catching a almost a 1 to 5. Okay. And that's not even the lowest point. So even with the more conservative entry, you're still looking at almost a 1 to 5 in 5 hours' time. Okay. Um, but again, bear in mind, that was capping at the high. Yeah, exactly. Exactly. That's just capping at the, at the highs here.
And of course, you should be short, even a 0.2, like 20%, uh, your runner of your original position can do crazy numbers. Right. And sometimes can even be the same or half or more than your original position.
100%.
So, you know, the beauty of having a high reward to risk ratio is it allows for that. 'Cause even if you took majority of your volume off at 1 to 3, some people do that, right? They take off majority there, but then that partial, if it goes 1 to 10, 15, 20, then that normally that small partial is more, or if not the same as the original 1 to 3.
So yeah, completely agree.
But these elements that we're talking about, to your point that you said earlier, everyone has their own personality. So some people will be, you know, better off using a low risk reward. Some will be better off using a higher one. The beauty in this particular model when making that decision is really the win rate won't change drastically. Normally high reward to risk means low win rate, right? But in this case, because of the specifics around the model and when training the eyes and the patience has been developed to wait for the model to present itself before executing, and then of course the discipline to execute according to the rules, that low win rate doesn't need to be there, right? Um, which is incredible because it's very rare to find, uh, you know, the high reward-to-risk ratio with a high win rate. But this is how it's done.
Yeah, my, my honest truth about the— in my perspective on that whole scenario of, um, the smaller the stop the lower the RR. In some ways it's correct. However, in my opinion, the reason that actually occurs is typically for a higher RR to occur, you need a lower timeframe entry. Now what happens is people go into lower timeframes and they're, they're more prone to make mistakes. That's just, there's more price action, there's more time being shown to you on the charts. So people are more prone to make mistakes. When mistakes occur, lower RR, I mean, the strike rate will naturally go down. So that's my opinion. And that's my perspective. However, if you learn and prioritize patience and discipline and focusing on the high probable setups, your RRR, your, sorry, your strike rate won't get affected with this high RRR model.
Love it. And in terms of, I'll ask towards the end actually this question. Let's keep, let's blast through. One sec. But we got like 30 minutes, so we'll blast through all loads.
Yeah, we'll go through, we'll go through another lap.
Yeah. Okay, just blast through it. Cool. We've, yeah, I said, yeah, we don't have to really.
Yeah, yeah, yeah. Perfect. Alright, so now we're back on gold again, and I'm gonna show you guys the beauty of, um, basically proving to you the model is fractal again to all timeframes. So it can go from the lower all the way to the higher. So this will be an example of showing you guys even higher timeframe entries.
Okay?
So again, we'll just start, we can even just use the 15-minute timeframe just to see all this price action right now. Um, we can see how price from the highs, again, this is gold, big sell-off, okay? Big, big sell-off. And we have swept all types of lows on the left-hand side, okay? So any buyers in the market here, once price sells below— we understand that there was buyers that trading here, they've been trapped. So overall, I do want to start seeing price back up to the upside, okay? Your left equals up here, okay? And then price action actually in current PA, all this PA in front of us, look at the amount of liquidity we were building at the high. So we're going to briefly talk about all that., the reason behind this long, the logic behind this long. Um, but we're going to focus on, again, the model here, the Da Vinci model.
Okay.
So what can we see? And always, again, I would like to use red boxes here to kind of pinpoint all of this. We have the market tapping into this area once, twice. Look, then we go long. Okay. We go long off an area that had liquidity. Why did it have liquidity? We have low respecting low. Okay. And then we go long. Price comes up to the high and builds liquidity. Okay, so we have a level of liquidity just like we draw on the whiteboard. We have a level of liquidity we can look to target eventually. Then price sells off and we trade below an old low. Okay, again, nothing changes, just like we were talking about on the whiteboard. We trade below this old low. Perfect. From there, we understand that there is liquidity above here. We want to target that. Okay, now Price runs these lows to the left-hand side, we go bullish. This is gonna be a trap area. We do not want to be selling from these areas. However, you can already see that we are starting to get a Da Vinci. Okay? Since we are respecting the highs, this would be known as an engineered liquidity point. So we can just write quickly, engineered liquidity. Perfect. And We need to see early buyers in the market, okay? In order for us to capitalize on this buy back up to the upside, we need to see early buyers. And look what happens here. We have what I would call a buildup of liquidity. Why is this a buildup? Lows taken, okay? And then price comes up, takes the highs. Why is this important? This is a common retail pattern. Lows taken, highs taken, which means people want to be buying below the— or sorry, buying above this low. I view this low to have liquidity, so I want to buy below it. Okay, this is stuff we touched on in the previous episode, right? So if anybody is kind of shaking a bit here, rewatch previous episode or just watch it if you haven't yet. Um, again, the low is taken, which means early buyers are trapped. We want to see that occur. Coincidentally, we have a low to the left-hand side, okay, that we want to be using as our basically a level to put our stop loss. So check this out. We're gonna have entry right at the low. Okay, remember, I'm always buy once the liquidity's taken. I don't need to overrefine and find an imbalance in here. Entry taken, stop loss below the low, and target back at the highs. Remember, we're not guessing where to target, okay? The market communicate that to us right here. High respecting high. Okay, so that's gonna be our overall target, okay? Don't get me wrong, you have a bunch of internal, everyone's different. You can, if you're not comfortable holding full volume, maybe partial here, maybe partial up here, right? You have a bunch of highs to the left-hand side to target. Okay? Now following along with this price action, 'cause there's more than one entry here and there's a lot to talk about. Not gonna spend a whole bunch of time, but there's some good stuff you guys need to pay attention to. So we move bullish to the upside. Okay? And remember, Any bearish reactions, deem them to be false and a trap. This is now going to be known as— hopefully, hopefully you guys are starting to see this over and over— engineered liquidity. Okay, we sell off to the downside. Check this out, we trap buyers. Anyone buying above this low, they've been trapped. And look how price rallies to the upside and grabs what? The engineered liquidity. Okay, After that's taken, price goes bearish. But don't forget, guys, I can't stress this enough. Don't forget our higher timeframe target here. So if we do beautiful stuff, beautiful stuff, if we do react off this engineered liquidity, Da Vinci model intact, okay? Once we respect and move away any, whenever you find a buy opportunity, and I'm gonna show you guys exactly where it's gonna be, a Da Vinci model, and you wanna be targeting the highs.
Okay.
Just like we initially were on this higher type, or sorry, this, this first entry here. Okay, perfect. So we sell off to the downside.
Okay.
We start trading below internal lows to the left.
Okay.
We grab this low, we move bullish. Okay. From there, check this out. We sell off, we create some internal points. So we come down, we respect something on the left-hand side and we move bullish. So same scenario. Right here. Okay, same scenario is happening right here in front of our eyes. Okay, what do I mean by that? Price incre— it creates all these internal points here and here, and then you get a bullish push-up taking out these highs. Why is that important? We have just induced buyers. It's a common retail concept of high taken out, pullback, and they want to buy this thing all the way up, right? I view that to be early buyers. I want to see price below the low. Okay. And look, coincidentally speaking, just like we've been doing this whole time, you have another low. I call it a liquidity block. We have another low that has spiked out previous lows. So I don't view this low that needs to go. It doesn't need to get ran. So again, I always buy once the lows are taken out. Very simple. Stop goes below this low from the left-hand side. Okay, and what are we targeting? You guys already know the answer to this. All the way back up to the upside, just like that. So you have a possible 1 to 7.5 here, and you have another possible 1 to 7 right here. Okay, and again, it's the beauty about this is once you see it, you won't, you won't unsee it. But any bearish— this is very, very important— any bearish reaction is Engineered liquidity, right? Look, it's the same thing happening over and over. Okay? And then you get the sell-off that provides, you can call it like your discount or whatever. I don't view it like that, but you get a pullback, induce early buyers, and we trap them. Boom. Take off to the upside.
Because the beauty is, as long as the low and the high of the model, so the low and the high of what you're looking for stays intact, the setup is valid. And when you know which side is being engineered, so in this case, obviously to the highs, You know you're looking at buyers. Yes. Right. And then so all you have to do then, 'cause then, okay, that's a relatively simple concept to follow along. And this is a very simple model. However, then as you say, training the eyes and patience, because what a lot of people would do if they're not using this technique, but they have a similar structure in terms of targeting a high and they want to buy low, right? They might put a Fibonacci on, they might put on a range on, they might have a general premise of I want to buy below the 50% at the minimum. Uh, but then it's too easy for them cuz that really leaves still such an open window, uh, which within there they'll probably have order blocks, fair value gaps, inverted fair value gaps, uh, supply demand, wherever. So many, right? And then that's why sometimes people get the winning trade, but they lost 3, 4 times before it. So then, and their, their risk to reward's probably much, uh, larger, or at least let's say 1 to 3.
Mm-hmm.
So they break even by the end of it. Mm-hmm. Right. After all that work. While with this, you specifically have areas of liquidity to just wait for.
That's it. And the hardest part for people is literally just wait. And we've spoken about the previous episode, sound like a broken record, but if you don't see liquidity, you are the liquidity. So when big moves happen, you wait, you wait for liquidity to get engineered, things clear up and you take entries. And like, just to show you guys the common mistake traders make, you have a high taken out here, right? And this is going to be an area based off structure that retail wants to take it long. Look at the reaction it gives for retail to go long, right? And then overall gives a false reaction and boom, traps. Again, this happens. High taken out, high taken out. Price temporarily— and we'll zoom in here— price temporarily respects this and goes long for 2, 3 hours or 2 hours, and then boom, you get the sell-off and we trap. Okay, this is the entry. Okay, and that's supported by this low from the left-hand side. So that's the important part here, guys. You guys can see that every entry is repeatable. Every entry is systematic. The low here, that's where the stop loss goes, right? The low here, that's where the stop loss goes. So now we're gonna hop into, so we talked about gold, I'm showing you guys that it works in the forex market, CFD market, the commodity, whatever you wanna call it. Now we're gonna talk about NQ and how the DaVinci model can be used in the futures market. 'Cause as we know, like I talked about before, it happens across all markets. All right, um, so again, we're going to be talking about NQ here. Start off on the higher time frames. You can probably already see where I'm heading to here, almost an exact duplicate of the, the whiteboard examples we were going through. But price trades below an old low from the left-hand side. Okay, now that bullish idea is activated for us. We want to be looking for those buys. Okay, now if I open up this PA a little bit for us— perfect. So you can see Big sell-off from the highs. Follow my cursor coming down and we sweep out lows from the left-hand side. Perfect. Now check this out. Little possible extreme entry, not a Da Vinci, but still something to point out for you guys. You have price coming down all the way to this low and sweeping it, tapping into an area that we have not tapped into yet, otherwise known as a low that did not have liquidity. Okay. Now what's happening here is actually happening right in front of our eyes as well on the, in the current idea, the current price action. What do I mean by that? Price has sweeped out a low, okay. Creating this low that we view not to have liquidity.
Okay.
Now in order for us to take advantage of price back up to the upside, we need to see price engineer liquidity first, right? And what do we have here? So typically this is actually just like a POI on the higher timeframe. So retail, but this whole area here, right, is an area that sellers are gonna be looking to take maybe confirmation entry, entries off of, or just entries as a whole, right? Maybe here and then these whole areas here. Okay? So what we can do is again, we can just mark this on just to make this easy for you guys. Engineered liquidity. Okay? Any reactions in this area deemed them to be false should be a pullback and we're gonna participate in the buys back up to the upside. Okay.
Mm-hmm.
We go bearish. Now identify where buyers are at. So we're gonna open this up to the 5-minute to make sense of this as much as possible. Look to the left. Okay. Hopefully you guys are starting to see this here. High taken out. Okay. Price goes bearish, taps into this whole area. Okay. And then back up to the upside it goes. What has that now told us? We have liquidity below these lows. Okay, now this is when we were talking about before, this is when patience is incredibly important. Okay, if you don't have patience and you don't trust where the liquidity is, you're going to get caught up in all of this kind of price action. You're going to take unnecessary L's. Okay, that's when the strike rate gets affected. However, if you've identified this level of liquidity, it's very simple, wait for it to get taken. Okay, so this is an example, a great example of showing you guys For the people out there that can only trade the higher timeframes, for example, if you guys are not able to be active on the lower timeframes, perfect example for you guys. You have a level of liquidity marked out here, AKA early buyers. You have a low down here that we can put our stop loss. Perfect. So this is what it's gonna start looking like. Entry would be right at the low, just like this. Stop loss is gonna cover this low from the left-hand side. So again, for your higher timeframe people out there that can't be active, Limit. Simple. You set a limit at this liquidity point, this low, stop loss goes below. You don't even need to look at the chart.
Okay?
So this is why I wanted to use this example directly because show you guys that you don't need to stare at the charts the whole time. Okay? So entry, hopefully you guys are starting to see where we can target. You have equal highs left all the way back up here. Okay? And you also have these engineered liquidity highs on the way back up, which could be used as a partial point. All right, so again, whatever you guys are comfortable, if you guys can't hold 1 to 5 full volume, by all means, you guys can partial here, right? You're still capturing almost a 1 to 4, which is great.
Because you, as part of this model and because of this way of trading, you don't— some people like take partials just a risk to reward point, right? At 1 to 2, 1 to 3. But you don't do that.
No. And you know, it's something I've talked about in the past. I'm not the biggest fan of it. Typically, I think I'm analyzing the chart for a reason where I'm projecting possible areas, levels that price could run to. Why not take advantage of that analysis? Right? And like I told you guys before, if you guys do apply this model correctly, these targets, these levels, they will get hit and they will get ran to eventually. But they happen a lot. Like the strike rate of it hitting these areas is very high. Like I said, Don't take my word for it. Go into the charts and identify. You guys will see that, for example, once this low gets taken, I know eventually this high will go, and I'm very, very confident in that. Um, and it's something that maybe you just lack a little bit of confidence, but over, over time, you guys will see if you practice holding volume. Um, I would recommend removing that partialing at 1:3 or that small RR and just hold to those targets. That's when the profits drastically increase.. And that's something that I did a year, year and a half ago. Once I started holding more volume, the profits did increase, right?
Right.
And then again, the only way you can start stomaching that is literally just doing it over and over, right? But again, great example here. You have multiple targets. You have this engineered liquidity point, just like we talked about on the whiteboard. Very important here. Okay. And then of course you have the external highs being up here. Okay, so again, just based off your guys' appetite, what you guys are comfortable with, you have engineered liquidity highs being a target, and then the external point. If I play this out, you guys can see there's the entry, trapping the early buyers. You guys participate, and eventually—
I say eventually, look, this is the reality of the market.
Yeah, there you go.
This is NQ, and it's in Asia right now, so typically pretty price won't move too much.
But if we just bump up a timeframe, we'll speed this up a bit. And there, was there any other opportunities there?
So funnily enough, I actually, while the replay was playing out, yes, there was another opportunity. You can see how we are, what would we call this? Happy that you pointed that out actually, right? To make you very—
I'm learning. Well, the funny thing is, you know, people ask me about how I trade, 'cause last year I did over $100,000 in payouts whilst doing this. That was on the side, more swing trading, or at least like a bit longer term. This year, well, January, I've already done $20,000 in payouts. And I trade a lot of my thesis or foundation around this from you.
That's awesome. That's awesome.
And I just sprinkle my own stuff on there. And to be honest with you, I should probably remove some of my stuff because I think it just, you know, clogs or gets in the way. Yeah, sometimes. But it's working out. Not as a cock-a-blade.
I mean, you had six figures in payouts. I mean, something's working. Yeah, send the little humps. All right, so here we go, guys. Same thing. We have engineered liquidity at the highs, right? If we sell off again, it's just simply telling us we have a reason for price to push to the highs, right? Same thing. From this point, price moves bearish, takes out an internal low. Same thing occurs. Check this out. We have highs taken, which induce buyers, and then we come down and trap them.
Okay?
What ends up happening here is we go bullish again, taking out highs, inducing buyers, same thing, trapping them. And I believe it comes all the way down into what I call a— there you go— a liquidity block. Okay. A low that I view not to hold any liquidity. So you could have taken— and look at the precision here. Sometimes it boggles my mind to this day. You could have taken an entry. Here, stop loss needs to go below the low to the left-hand side. This is always okay. Now extreme entry here and target, I hope you guys can always see, is going to be the high. So this isn't the best RR. However, listen, it's still great. Yeah, sometimes 1:3.5 for people is phenomenal. And don't get me wrong, it still is great to this day. It's still a great RR. But again, just showing you guys how every single time the, the, yeah, every single time price respects the highs. It's engineering liquidity. Very important for the Da Vinci model to be in play.
What do you do in terms of breakeven for this model?
You know, what do you do?
You go breakeven at a certain point? Is there—
do you leave it?
Like, what's your rule set?
So yeah, talking about managing trades, it's actually very simple, very straightforward for me. And that's another thing why this model is so beautiful, is it's just so repeatable, so systematic for myself, where as soon as I take this entry, okay, and price takes out highs, some sort of highs. I understand from, uh, from the, my system, the pers— the perspective of my system, that buyers are induced some way. So this high gets taken out, okay? This point right here. Let's just say we're in this trade, we enter, high gets taken out, I roll my stop to breakeven, okay? And I'm very extremely confident in my target getting hit. Now, does that mean it's going to hit 100% of the time? No, there's going to be times where I'm breakeven, and it is what it is. However, I'm very confident this target getting hit, so I'm going to hold my full volume to this target. Okay, um, and yeah, that's, that's basically it. BE here. And I typically will hold majority volume to my targets. If I do partial, I do partial very, very small, right? So I'm talking 20-25% of my, uh, position. And I do strongly recommend holding to those targets, right? Those areas that you project price to head to.
Gotcha.
So just like I spoke about with NQ, now we're gonna hop into a Forex example. I trade this market actively. So of course this model is, it works and it can be applied to this market. This specific example, we're gonna go through UJ. Actually, funnily enough, a trade I just took this week and I realized $6,600 and I still actually have partials. Just funny enough, just like Riz was talking about before, I still have partials running to higher timeframe targets, which could possibly bank me another $5,000. So it could be north of $11,000. We're going to have to see maybe in future episodes if it plays out.
But nonetheless, this comes out. Yeah, he will slap it in there.
I did realize $6,600 and it is a Da Vinci trade and it's a bearish example. So it's going to be good for you guys to see. Yeah. So this is a good trade here. So we have again, this is UJ and we're going to start from the higher timeframes. Work our way down to the lower. We have highs taking out— taken out on the left-hand side here, okay? Ever since then, we've been moving bearish, okay? And you guys can already see there is a shit ton of targets to the downside. So I'm actually projecting this thing to move quite heavily to the downside. We'll have to wait and see if there's more trade opportunities, but nonetheless, the sell I took— so we sold off, big sell-off, but therefore there was still levels to the left-hand side I want price to move to. Okay, and what do I mean by that? If I zoom into this price action, we can see a level of liquidity built. Why do I say this is a level of liquidity? Low, high taken, highs taken, lows respected, lows respected. So there's a level of liquidity, right? It's all it is. And I'm just identifying that and understanding that that could be a possible sell target for me. So if we go to live price action, you can see the cells played out. But let's talk about the actual setup as a whole. Very important stuff to cover here. So I'm gonna drag this over now. Old low from the left-hand side here. Okay. We haven't taken it. We're actually respecting it. So you guys should already know what that means. This low down here that we're starting to print is known as engineered liquidity. Okay. We are building liquidity here. Okay, from there we start moving bullish, and there's lots of good things to talk about here. If you look on the flip side and identify where sellers have been entering— hopefully you guys are starting to see this— but we have been taking entries at this high— or sorry, we've been respecting this high for quite a while now, right? Why did I grab this point? I've literally let the market communicate to me to mark this high out. I haven't predicted it, I haven't guessed it. The market told me that this high respected this high from the left. So Once it moves away, we have built reasoning to, for price to push up there. We have built liquidity, whatever you guys wanna call it. We have a reason for price to push above. Okay. And again, you can see here respects it, respects it, respects the spread. It taps into it a bunch. So that tells me mark out this high. I wanna see price above it. Now after price takes it out, we're gonna look for sells. Okay. Now how do we participate in the sell back down? I need to see what I would call a liquidity block, right? You guys all know this by now. This is a high that has taken out a previous high. Okay, so look, low taken, price comes up, takes that high out, and we sell off to the downside. Okay, so this is gonna be an area. Remember, there's no reason for price to take out this point right here, so I'm gonna use it to my advantage and take an entry off of it. So I mark out this whole area. Now my entry actually wasn't the top. And the reason being was because I set a limit. It was my bedtime and price started playing out. It was my bedtime, I say. Price started playing out in London. I live in Canada, I live in Toronto, so I'm not awake through 3:00 AM, 4:00 AM.
There was a time.
Yeah, there was a time, unfortunately. That's a story for another day. But nonetheless, this was a limit entry. And this is the beauty of taking higher timeframe entries sometimes. And for myself, you can do this in the CFD market 'cause you can hold it for a couple days, right? So I can take advantage of that. So entry, now check this out. This is where a lot of people make the mistake or make mistakes. There is a shit ton of liquidity to the downside, right? And price has taken out highs, comes down to the lows, this low respecting here and moving bullish. So we have built a ton of liquidity to the downside. It is a great confluence for us to see that because now price has a reason to go lower. So again, here is our engineered liquidity, Da Vinci models intact. We take our entry here, stop loss above, and now we're simply just riding this down to where? The low from the left.
Why?
Because that is engineered liquidity. And there you go, um, 1:5 here. And yes, I'm looking for further downside, but just to keep it easy, simple, and sweet for you guys, you have this low here being the target from the left-hand side.
Amazing.
Very, very simple. Very straightforward.
Honestly, the one question I had earlier that I said I'd come back to towards this is training the eyes is like the, the theme throughout this episode. Like, what does that actually look like and mean to you for the audience at home who want to develop this? Because no doubt, I imagine pretty much everyone watching is going to want to try and implement this in some way. Like, what do they need to be doing in order to train their eyes and get that level of insight that you've shown?
Yeah, that's, that's a great question. Um, I think training the eyes is incredibly important. Uh, now what do I mean by that? Um, repetition and consistency. So that's why we're, me and Riz are sitting down and going through a bunch of examples right now and showing you how to apply this model over and over and over. And what that's, what that's doing is it's training your eyes.. And the importance behind that is if you train your eyes as much as possible, meaning you apply this over and over and over and over. Now when you go into the live markets, naturally you will start seeing the model play out in front of your eyes, right? However, if you lack experience, you lack repetition, you're not training the eyes, then how are you supposed to go to a live market and identify this model in live time, right? So that's why I use that term actually a lot. Training the eyes is very important too. Because if you don't, then you're going to struggle to perform and you're going to struggle to identify these setups in live conditions, right?
That's true. Now, links for Marco will be in the description below, so make sure you check those out, drop him a message and thank him for the value that he has dropped today. Other episodes are on screen, talking of which, we'll link Marco's previous episode. Even at this point, he's already told you 3, 4 times if you haven't seen it, but we'll do it one more time. But make sure you hit subscribe. And until next time, everyone, this has been Chart Fanatics. Take care.









