The ONLY Fair Value Gap Video You Will EVER Need
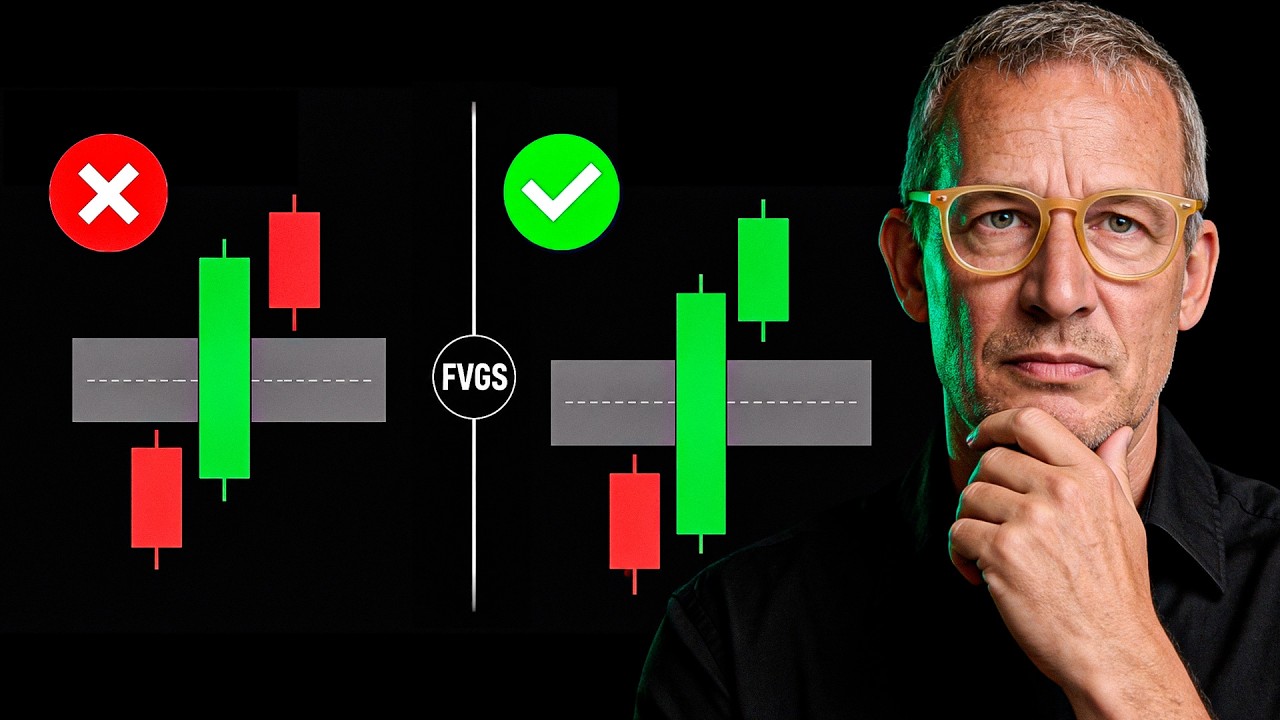
Fair value gaps are fast-moving price zones, but they're only reliable support or resistance under specific conditions: sufficient liquidity on both sides, a trend-stable market phase (about 30% of the time), and a small opening range. The first test of a gap may hold, but the second test often fails.
Chapters
I have discovered the secret behind fair value gaps, and I can tell you, fair value gaps are all the rage right now. But why do so many people lose money with fair value gaps? I can tell you right here that it makes no sense to trade these gaps blindly. It's absolutely essential to look closely at how you distinguish a good gap from a bad one. What do I mean by that? You have to figure out how to do it, what experience you bring to the table, and how you can then handle it. And that's exactly what you need to do. And I can tell you something else: you need a precise step-by-step guide to follow this path for yourself. So stay tuned, it's going to be really refreshing for you to see which gaps make sense, which don't, and when fair value gaps are real resistance or support areas that will lead you to your goal. Yes, today we want to go a bit deeper into fair value gaps, into the logic of gaps in general. But fair value gaps are a specialty, of course, because they're just fast movements where a price moves extremely quickly. The only question is always what happens when the market gets back there. And that's exactly where we're going to get to the bottom of things today, adding a few analogies to market profiling to get a deeper understanding. Because at the end of the day, fair value gaps are usually nothing else. I call them space areas or single print zones where a market has just zipped through quickly. Now you need to know the following: such price ranges can either be targets for market participants, or very often price ranges where it zips through quickly. And the third thing, which is unfortunately very often assumed, is that fair value gaps are great support resistance levels. They are, but only if the market has trend stability, and if the open range wasn't that large, and so on and so forth. And that's exactly what we're going to look at now. Before we start going deeper, let's take a look at this and first find out what it's actually all about. Look here, for example, the market opened, this candle flickered briefly, and then the market zipped through. It had a pullback to here and kept zipping along. What does that create? This creates a space where the market was ultimately traded quickly and aggressively. Exactly the same. Now the market runs up again and breaks down again, and it has its highest pullback to here and goes down. Now there's the assumption that the following happens: if the market runs up here now, it's often assumed that the market will start an aggressive movement downwards from here, because many people assume that these fair value gaps are price ranges where the market simply has a resistance or support area. And now let's get to the bottom of it a bit more deeply. Let's take a look at a picture like this and think quite logically about what's actually happening in the market. So the market moves, moves, moves, and then it does this, right? What is usually behind this? Usually fast movements are typically caused by big— oops, let me clarify— by big money having a reason to act quickly. It could be due to an imbalance, but it could also be, for example, important fundamental news, such as a major announcement or a significant event or whatever. And so I have a so-called fair value gap area here, and this area should first be classified. Why did it even occur? Because very often there is a lack of liquidity in such price ranges. Then now you absolutely have to look at what took place here before. And if there was also little liquidity there, for example, and the market zips through here and runs back down and comes up here, well, what can we assume then? We can assume that low liquidity means rejection, and rejection means the market can also turn there for now. But what do most people forget? Most people forget to look at what happened in this price range here. And if we now have the distinction— here, for example, there is very little liquidity, while over here there is actually a lot of liquidity available. This clear difference in liquidity between these two areas is quite apparent. What does that mean? It means that the price down here was fair, but it also means that if a lot of liquidity was traded here and the market moves up again, For example, there's a high probability it'll do this and then do this. Why is that? Because there's nothing in the way. This means the first insight we should always have and check is what the trading range looks like before the fair value gap and what it looks like below the corresponding fair value gap. And that gives you a decisive advantage if you understand how the principle behind liquidity is structured. But let's get to the bottom of the whole thing. Before we get back into it, a quick notice. World Class Edge just launched. And if you want to know how really institutional traders and market makers actually trade, click the link below and secure your spot at World Class Edge. Alright, back to it. Let's look at this chart here. In this case, it's the NASDAQ. And the market just plummeted here. So now the question is, of course, what happened in this move? And now I could do several things. I could examine how much liquidity was present in the individual price ranges. That would be one possibility, and so on. But I can also say, first of all, I'll see where the market has price ranges where it really formed so-called levels that were formed by the fastest dynamics without a pullback. Without anything. And when I do that for myself, I can say, okay, that's a target area for now. Why do I say a target area? And that's why I want to show you the market profiling concept. For example, we have these so-called single print areas here, right here, and also here. These single print areas are in reality nothing more than specific price ranges where the market never actually retraced within this particular move, at least when viewed from a 30-minute chart. So in the end, it's really almost the same thing, except that this single print area shows a single point. The fair value gap shows this zone accordingly. And because of that, you can clearly say to yourself, okay, if I understand that market profiling concepts and fair value concepts actually have a similar— well, let's say, level of competence— then I can certainly focus on the smarter concept. And if I take the concept from the market profile and say, okay, let me look at what kind of analogy these single print areas have, then it's quite simple. This here is a typical trend profile, and if the market continues below this now, yeah, and it comes back up here, then first of all I have the supply and demand game again. And if it runs above this now, then these single prints are target areas for many market participants. That means that's where they exit the market, but they don't enter. Do you notice something? They're saying quite clearly that in the end, the market does nothing more than give me a so-called target area scenario. This means market profiling concepts tell you the probability that profit taking will be carried out when a market returns to a single print area is quite high. But do they also tell you that you should enter there? No, they only tell you that if there's a combination with another structure, for example, a value area or something like that, which underlies the whole thing. So what is fundamentally decisive? Let's take a look at that now. So take a look, if you have a fair value gap at an all-time high, for example, many people have that, they like to see it, right? So, and let's say there was a short range here as well. That wasn't the best drawing, so let's redraw it. So this was the all-time high. The market does this and then it does this. So now you have a fair value gap here, and this fair value gap simply gives you the opportunity to say, all right, the market shot past the all-time high and has probably established a trend up here now. So what's cool for me now, since the whole thing is trend stable— watch out again, 30% of the time we have trend stable phases, 70% of the time we have balance, that is very, very important— and if the market now gives you the following and says, okay, I'm running down here, it makes perfect sense to first see here if you don't get a trend continuation at this fair value gap. But now it is very, very, very, very effective to look at how the liquidity looked before the market went above it and after the market went above it. Because always remember, liquidity and balance phases is always the be-all and end-all to be able to assess how high the probability is that the market will make a pullback from there or not. So Now, the market might run up here and have no more turnover up here, and has already tested the fair value gap. Assume that if it comes back down here, it will blast through. It won't hold a second time. The probability is very low. This means that on the first attempt it tends to hold, on the second attempt it will most likely not hold. Let's take the reference to market profiling again, shall we? If you draw a corresponding profile from this concept here, for example, then it looks something like this. A white one is bad. Like so, so, so, so. And now, you know, great, here is the single print. This means, as you can already see, single print is always to be found in this area here, usually where it originated. And you now have to be able to assess how high the probability is that the market will give me a reaction here or not. And you can do that if you locate for yourself what was here, what liquidity was here before this fast move came. And additionally, what structure do I have underneath here? And that is much, much more important than saying every fair value gap works. Because again, this only works in 30% of market phases where we are truly trend stable. This means that if you have the ability to locate that the market is currently in a stable trend, yes, then it makes absolute sense to use the fair value area as a trend continuing instrument and to say, here I can see if I get a trend continuation. But if you don't have this exact phase, but rather a volatile fair value gap in a sideways phase And if liquidity up here isn't high, then there's a good chance it'll just be traded through. And you really need to distinguish that. I hope this video helped you. I hope you enjoyed it. I tried to keep it very simple just to explain the basics first. And remember the following: about 30% of market phases are trend stable. The concept works brilliantly in so-called balanced market phases, which unfortunately occur 65 to 70% of the time, this concept unfortunately only has limited success. And remember, last but not least, if this is the fair value gap, the market— oops, that's not great— the market has the whole fair value gap here. It's already tested it, moves back up, and then returns to it. There's a high probability that it's going to break through now. So don't use it repeatedly to try and find a trend continuation trade here. I hope you liked it. I hope it helped you. I tried to explain it in a super easy way without adding a thousand different complexities, because you really don't need them. All you need is balance or trend, trend continuation for the day. High probability, no trend, no trend continuation. During the day, the probability is lower. Open range, meaning the opening range, if it's very large, it likely won't hold. If it's very small, it likely will. That's it. That's all the information you need. So I hope you liked it. Bye everyone.









