The ONLY trading strategy that will still work in 2026 (World Champion explains the PbD Method)
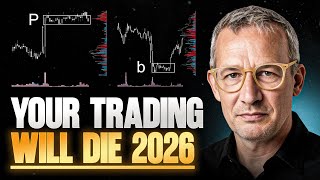
A YouTube video by a trader (Kardec Trader) presenting the PbD market-profiling method and offering a market outlook for the start of 2026. The speaker gives technical explanations and trading ideas across multiple assets (gold futures, silver, S&P futures, bitcoin) and frames analysis from the perspective of 'global players' and liquidity structure.
Chapters
The Perfect start in 2026 with trades and traders with world class edge. I give you a big explanation. What is a quick watch to the market from my side with marking profiling structure with the structure of the PBD in combination with a lot of other things, it is so important to look and to think like the global players what their thoughts about the start of 2026. Explanations about gold future, silver and S P future. I give you a lot. Also bitcoin. I look for bitcoin. I think it will be amazing for you. Look this video, I think you love it.
I translated this with AI.
That is perfect and I think it.
Is amazing cool for you to understand.
Very deep my explanations of the markets. See you soon. And there's a like here from me, please.
Yes. Before we get started, I want to give you a brief overview. Which markets are interesting to me? For me it's always interesting to see is it risk on or risk off. That means is there currently a flow of capital into asset classes that tend to involve risk, such as for example the mag 7 or bitcoin. Just as we also see that all of a sudden in more restrictive markets like gold, silver and so on, there are incredibly large capital flows present. Yes, all the fundamental stories behind it, we could build a lot out of that. But we can also simply gather the facts that the chart and above all liquidity provide us and then we make a plan. From what point does it make sense to re enter the markets and continue riding the long wave? Or maybe it even makes sense to wait for a pullback or to consider short speculation. That's exactly what I want to show you today. And that's why I've prepared some charts for you and I'll go over them with you so you get an impression of how I approach this at trade, the traders and what are my areas of expertise with regard to the technical approach in the long term sector to evaluate these markets. All right, let's start with Bitcoin. As I just mentioned, Bitcoin is of course always very exciting, especially when you put the risk in the foreground. And I'll keep it relatively basic and simple to give you an initial overview. This here was my first B. Back then I made it very clear that from that point on the markets would very likely continue to drop sharply. That's exactly what they did down here. There's liquidity again. And now we're exactly at this level here. And as you can see here, there's another nice sideways phase. And even without bringing in the bitcoin futures, I'm immediately aware of the fair prices that means, or rather that means the equilibrium currently lies here or somewhere in this area and everything in between is just space for now. Market profilers would partly call this single print areas, but in the end, only one piece of information matters here. Large capital pushed the price down. And now the big question for us is what can we derive from this going forward and how does the whole story continue? And I can say the following very clearly. This B structure that we currently have in Bitcoin is interesting. It's interesting in terms of evaluating whether this thing will now pick up speed to the downside or are we really going to move further up from here, just as many expect? And will bitcoin soon make new highs again? I can tell you the probability that this will happen is not very high for now because there is a lot standing in the way. Very large addresses have simply taken capital off the table here and have certainly also built up large hedging positions, I.e. protective positions on the short side. And as long as we don't sustainably break out of this price range to the upside and gain acceptance in the old balances, I assume that things could continue to move downward. Especially if we continue to linger in this range and supply and demand remain down here, the probability is high that Bitcoin will keep falling. Let's take a look at the Euro dollar, a quick look. Why Euro dollar? Because the US dollar is always considered the safe haven when we have a risk on environment. I know normally you would have to include other currency pairs or just look at the dollar index. But for me, what's interesting right now is to see how things are looking in Europe at the moment. And here's how I approach it. And I'll also show you the whole thing from a market profiling perspective in a moment. Right now we can see it beautifully here. Again, there have been several nice levels where the market has simply moved steadily upward. For now, this means that the Eurodollar has definitely pushed the markets up aggressively from down here even twice. What does that mean for us? For us it means there is a certain level of stability. But what I see here is interesting now. We now have a very long sideways phase here and you can already see that right away we broke out to the upside here, but didn't get any further. For now here we've already hit a bit of resistance again and that means there's definitely a possibility that we'll go down here again first. As I said, it's a very long term picture. But if we move over here and generate liquidity up here, then the situation is such that we will see a really strong rise against the US dollar and then things will get interesting. As long as we're in this range, there's not much to expect for now, provided that this balancing act with the counter setup we've received here continues to hold. All right, let's take a look at the whole thing from a profiling perspective. What does something like this look like in the market profile? And in the market profile, I always look at many different components, especially with regard to the past few weeks. I can already see that this is a large range. And over the past three weeks we've accumulated liquidity up here, all in this price area. And now this week we are already lower. That means if I simply compare the whole thing to prices now to the chart I just showed you, I can also see it here. I have first of all, the evidence that the market can definitely go a bit lower. And so I put two and two together and I'm actually quite pleased because I can see that in terms of liquidity, the Euro dollar has also just moved downward for now. And as long as we stay below 1.1770 in the 6e future, which is the corresponding futures contract and do not generate new liquidity here, we could definitely go a bit lower as well. And then from a broader perspective, that fits for me. Let's move on to the S and P and take a look at how it's currently doing. Yeah, I don't think there's much to say about it. The market is very stable, it's moved upward. What I see now is the following year end, and here's a tip from my side that was the case here. So we're currently in a price range that's about $200 than at the end of the year. You'll notice that very often the major market players only come back into play next week, and then there's still a relatively high probability that the market will return to around the year end level. This is not a suggestion to take a short position because technically it must be said quite clearly that it's interesting for now to see how the whole situation behaves here. Based on our last range. And here I can definitely and clearly observe that we are currently positioned significantly above this particular range. There is a continuously rising amount of liquidity present in the market at this very moment. Then we have room to the downside. Again, everything that happens above this level is for me initially oriented to the long side. And if that's the case, and I have the information that we might be looking for a nice pullback here, then that's exactly what I'm looking for right now. Is this indeed the price area where I am patiently waiting for a setup to effectively enter the market accordingly for a potential long position? Or if there truly isn't a viable setup for a long entry at this particular moment, then yes, I will definitely look for a suitable setup to go significantly lower down here. What I can see really nicely here is once, twice, and perhaps we will indeed come down here for a third time. And anyone who truly knows our strategic approaches and tactical methodologies will also certainly know with a very high probability that at some critical point it just completely snaps to give us a good setup. Now let's take a look at the whole thing from a profile perspective so we can get an idea of how you can read all this quite easily on a weekly basis using the market profile. As I said, this was a nice profile that had formed and initially looked like a correction down here. The POC is still open as well in the area of 6,840. But what have we seen over the last three weeks? In the end we have a balance and this balance has currently been broken to the upside. And up here is also this week's liquidity. But this week is still young. So the question is, and here you can also clearly see the discrepancy between the market and volume profile. The volume weighted POC is up here, while the time based POC that is the point of control from the market profile is down here. And I can already see that there is a discrepancy here. That's why I'm a bit cautious about going all in long right now. In the short term, of course it makes sense you can look for long entries because especially down here at this lower level, we got a nice counter move. And that's why we're going to take a look at the whole thing. So let's go back. Remember this price range of 6900 as the lower boundary and take another technical look at it. So 6900 is the price range here? Yes, it could definitely go down again to that level. If we meticulously repair the entire thing, then we will observe how the market truly behaves down in this specific region. Because this particular price range right here is the significant area between the top and the bottom. There's another chart I absolutely want to show you today and that's silver. And there's a special story when it comes to silver. Last year, silver had a performance of well over 150% achieved. Now we have to consider, is there actually a shortage? Or has the industry become so heavily dependent on silver that the entire market is being bought out? Or is the whole thing maybe a bit exaggerated? Let's take a look at this. If I just consider my PBD logic in a simple way for myself, this was actually the last time when silver was moving on the short side. As I previously stated, back then we were operating within the price range between 30 and 28. Since that particular time, we've only experienced one significant fake, which briefly suggested the possibility of lower prices. Otherwise, this crucial balance here has now effectively ensured that the market has been significantly pushed upwards in classic, recognizable P waves. And at this very moment, this is the critical price range where I firmly believe it absolutely has to hold its ground. In terms of liquidity, I already see an absolute extreme here. That means major market participants have stepped in here and cashed out. And yes, the really big and significant question now is, of course, what exactly happens if we unfortunately fall below this crucial price range here? And I clearly stated yesterday, if I personally hold physical reserves in precious metals like gold or silver, it might very soon be an opportune time to seriously consider setting up some effective hedging strategies. This is important in order not to lose too much valuable liquidity in that particular regard, protecting my investments, because there's room for movement and specifically there's room down to these price ranges for now. And now the question is, do I really want to miss out on these moves if it crashes below that level? Let's take a step back and look at the market profiling. And here you can also spot something really interesting in silver. Namely, the liquidity in the profiles was always at the bottom. That means everything within the price range between 70, 71 and 67 was actually the price range where very, very fair price discovery took place. And when I see that yesterday evening at a price level above 80, I said, this smells fishy to me. That's a bit too extreme. There could be a possibility that we first return to that liquidity. And if we go below this liquidity, then things will get really interesting because down here there's still a lot that needs to be fixed. That doesn't mean we should go short on silver like crazy, but we should be very cautious and maybe take a look at how things are developing on smaller time frames. I've already done that, and that's why I'm being careful at the moment. With silver. And I would say if we have a lot of physical metals in our portfolio, we should definitely consider certain hedging strategies for ourselves. Yes, I could do the same thing with copper. Now, copper is also very, very interesting and it's actually pretty easy to see. We remember that bang. And when we saw this B here, it was tested and then surpassed again. Yes, that was good. That here, at least from a technical perspective, the consequences, whether it always turns out exactly like that, well, that's a probability. But as we can see, it worked out. And as long as we stay above this price range, there's obviously endless risk on potential. And let's take a look at the whole thing as well. And here too you can see it's very interesting because copper had a lot of liquidity down here, this profile as well. It was also characterized by absolute liquidity at the bottom, but then closed up here, a total anomaly. The following week, prices already moved up again. And here you can see that very clearly. The market started and immediately launched the next rocket. To me it clearly looks like there are people here with a big problem and not that that they really think that silver, gold and copper, in other words, the precious metals, are now going to rise to 6 million. I'm being cautious. I can imagine the following scenario, that liquidity is simply a bit thin at the moment because a lot of this happened pre market. By pre market I mean pre session around the turn of the year towards the end when the global players exited the markets second, third week of December. And let's see how things kick off in the markets next week. I am looking forward to it and I hope you enjoyed this. I put in the effort to give you a brief overview of what I look at, how I assess the whole situation and briefly from the PBD logic and briefly from the market profiling perspective, which always helps me to see whether the liquidity also proves that these stable, strong trends are really present right now. If you enjoyed this, leave me a like and feel free to recommend our wonderful YouTube channel to others. I think we're really building a cool business here to simply show you some great opportunities to position yourselves in the capital markets in a relatively easy way. Of course, these are not trading recommendations, but rather to create an awareness for you of how you can act in the capital markets with logic and reason. I really enjoy it a lot. I'm really looking forward to the new year. See you then. Bye everyone.









