The ONLY VWAP-Video you will EVER need (Trading World Champion reveals)
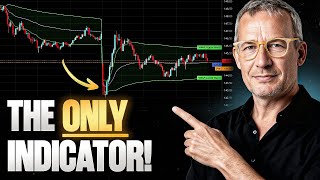
YouTube video by Tom Furberd explaining VWAP (Volume Weighted Average Price) as a trading tool. The speaker introduces VWAP as commonly seen as simple but argues it requires structure; he will explain usage, exercises, and risk/reward considerations to help traders become comfortable using VWAP. The speaker identifies himself as Tom Furberd and mentions training prominent traders.
The only VIVA video you ever need. Because I give you a big explanation how you can use VIVA for yourself to become comfortable trades with a big.
Risk of reward ratio. Why?
A lot of people use the VWAP as a easy, simple tool for trades and it is not so easy. You have to structure a little bit more and I give you all the explanations and my exercise of it and I think you will love this video for yourself. I'm Tom Furberd. I'm the builder of a lot of big traders like Patrick Nell, the World Cup Championships leader and I think for you it will be amazing. Good to understand everything Deep. I translate this video with AI. I'm not a native English speaker but I think I have done my best and you will love it.
All right my dears, today we want to take a deeper look at the vwap. I've prepared some great things for you, but first I want to briefly summarize what this is all about. The VWAP is nothing more than a volume weighted moving average that is calculated based on time and volume, which of course gives you the opportunity to see where the average price of the trades for the specific period you are looking at is. Because you need to know the VWAP is time weighted. But before I say too much, let's jump right into the chart and see what we can do with it, what logics and challenges it brings and what opportunities it can open up for you. So what is the vwap? In the end, the VWAP is nothing more than a moving average. As you can see here in a sideways phase, that's this white line that I'm showing. And then it transitions into a trending phase and you can see, and this is very important to note first, how the market often moves back toward it and then away from it. And when we have gaps like this, it's always especially interesting and important to understand what's actually happening there. You can see it here. The VWAP jumps upward. What is that related to? It's quite simple. The calculation of the VWAP is always session based because then a new day begins here and when a new day starts, the VWAP resets to zero. You can also display the VWAP continuously, but I don't think that's useful. Additionally, it's not necessarily a bad idea to look at the VWAP during the main trading hours of the respective product because that's when the trading volume is most significant and strongest. And as we know, it's a bit like with the volume Profile. Here you have a corresponding volume profile, as I've shown in many videos already. Somewhere here you have the vpoc. That is the point of control. That's the point with the highest trading volume. And then we have a value area high and a value area low. How does that help us? Let's move on and observe the VWAP and then establish a connection. This is now the VWAP for DAX future, in this case during the pre session in the morning. And you can see that it's moving completely sideways, just like the market itself, which makes sense because the volumes are being aggregated there. Now let's look down here and we see, okay, the VWAP continues to move sideways like a moving average. But the prices, on the other hand, are moving away. And very often the market likes to return to the vwap. Then it goes above it, then it goes below it. But now comes the crucial point, and this is really, really important to know. The moment a market starts trending, the probability is simply at first that the market does not immediately return to the volume weighted average of the period being considered. And I'm aware that there are many strategies that look for counter trades here, and that's not necessarily a bad idea. But let's take a look at the whole thing in the volume profile so we can better understand the context. Let's imagine the price movement is currently somewhere around here and the VWAP is in the middle. Then the probability is simply high at first that the market will keep returning to equilibrium. Why? Because large market participants prefer it when a market is traded in equilibrium, since that's where they can calmly build up and unwind their positions. So the first important piece of information for us is that the VWAP is always interesting to observe when a market is moving in balance phases. But for that we first need to be able to identify when a market is actually trending and how stable that trend is overall. That's why you shouldn't just trade blindly. Unfortunately, there are many algorithms that do exactly that. They say that when a market is a certain distance from where the VWAP is constructed, let's assume the market has dropped from here down to here. Then they start building positions to move back up again, back to equilibrium. And now let's take a look at the whole thing in the volume profile. For example, the market now drops below here and starts to generate volume here. That means fair values are well below the value area. I want to make this a bit clearer for you by drawing it out again so you understand exactly why the relationship between volume transactions and the corresponding midpoint is so important. So that means we knew here the market is in equilibrium and now it moves away and drops down here, just like here, for example. Now, there are many strategies that aim for the market to return to the vwap. And now imagine the following. We now have new fair prices far below the value area, so well below the day's equilibrium. That means the big market participants now have a problem. At first the market starts to become trending, and when you see that, then you have to assume that a trend continuation is likely for now. So if you now start to build your first long position here, and the market doesn't move back up, and now there are algos that build the next long position here and the take profit would be here, then it's just really, really difficult to figure out for yourself how do I handle risk management. That's why it's absolutely essential to understand that it can be dangerous to use the VWAP as an indicator that the market will always return to always revert to equilibrium. Especially when a market becomes trending. Because it would be the same as if, for example, we assumed that the market would always return to the point of control. But it doesn't do that either. Instead, there are phases where it just keeps moving further away. And it's the same with the V wap. So what can we do if we say the market will always try to return to the V wap? Let's create a new chart and see what we can do with it. Let's take a look. This here is the price movement and the V WAP has moved something like this. And what's the first thing we need to check for ourselves now? The first thing we need to check is is it now more likely that the market will move into a trend, or is it more likely that the market will move sideways, meaning it's in a balanced market. And this is where many people are separated from the pack. Because if you now recognize that the market is starting to trend, then I first need to understand rules actually apply to a market environment based on which I can claim that there are now trends. And for that we can, for example, consult the following. We can go ahead and say we use the profiles from market profiling to get an overview, for example, to see if there are single prints present. That means have aggressive market participants entered this trend and started to dominate the market and aggressively push it downward. Why? That doesn't matter for now. What matters to us is that these VWAP strategies which primarily mean that a market returns to the VWAP simply do not always work. And that is the first indication where we have to clearly say if we have several single prints. Caution is advised with such counter strategies aiming for a return to the vwap. Let's take it a step further. Let's take a look at what else we could figure out for ourselves. For example, if we refer to the past and see that there are exciting, interesting support and resistance levels from previous periods, and we also have the opportunity to explore whether here, if we get a setup to enter a trade against the prevailing trend, then it absolutely makes sense to perhaps use the VWAP as a profit target. Because we always have to keep in mind that the VWAP is a component that global players, the big players, like to look at to determine if we're below the vwap, it's short. If we're above the vwap, it's long. Everything driven by the market. But the probability that the market will return there is actually quite high. It's a bit like assuming that markets always tend to return to the VPOC to regain balance. And that happens about 70%, a little over 70% of the time. But heaven help us, if that's not the case, then we really get hit hard. And then it's also the case that with the strategies we often see, those counter strategies that are built on the idea that the market always comes back to something, always returns to something, can really kill us, because if we keep building up, that can seriously backfire. Let me quickly give you an example of this. Take a look. So if I look at the market and it's moving aggressively here, downwards, the vwap, of course, also follows to some extent, but not as quickly. And now the market forms a balance, accepts these lower prices and continues to move further down, then the VWAP will also slowly start to follow. But the probability during a true trend day, and that's about 20% of trading days for many products, is simply that we also close at the day's low. And if you've built up positions now and said the market will return to the vwap, the first position here, the second position there, and then you have an average price here, but the VWAP just never came back to this price level, then at some point you have to liquidate. And what if you get some really extreme momentum in the market and it drops sharply? Then, yes, mathematically you have a really big problem. But, well, that's just how it is sometimes in the stock market. So what do we take away from today and what is absolutely crucial and important for us? The most crucial and important thing is it makes sense to approach the VWAP again. It also makes sense to see at the VWAP itself whether I might be able to take a bounce there if the structure is sideways, imbalanced, if the market is trending, which you can determine in many different ways, what does the opening phase of trading look like, what profile shapes are predominant, what news is coming up today, then please be mindful of that and therefore never think that the market always has to come back to the vwap. And especially don't pyramid and keep building up your positions. I can tell you, you make 20 trades that work out and then on the 21st trade, some news comes out, it wipes out your entire position. And if you don't have good risk management, and unfortunately not many people who use such strategies do, including all those algorithms built on top of them, then the whole thing will blow up in your face. So VWAP is cool. It gives us an indication of where the market is in balance, how we can get back there, whether it makes sense, and if it gets there, we can talk about a bounce. Secondly, when a market becomes strongly trending, please stop trying to get back to the vwap. But if that's the case, and maybe just as a final point, you have the opportunity to look for a trade at the VWAP in order to continue in the direction of the trend. I hope you enjoyed this video and yes, give me a like, I'd really appreciate it, thank you very much.









