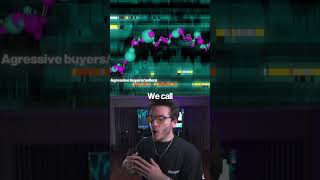
Order-flow trading uses DeepCharts' DeepDOM heatmap to show where resting liquidity sits and where aggressive buyers or sellers are hitting it, across stocks, Bitcoin, gold, and forex. Understanding how market makers and takers interact reveals how markets actually move.
Chapters
If you're a trader who hasn't heard about order flow yet, you might be living under a rock. It's like not knowing about AI. So here's what this is all about. A lot of traders are now ditching your old and boring candlestick charts and replacing them with charts like these ones. This is DeepDOM by DeepCharts. And if you open, click new price chart and select either NASDAQ, Bitcoin, gold, euro dollar, you name it, it will open a heatmap that will literally show you the treasure map for the trading day. These hot levels are areas of resting orders, resting liquidity. These bubbles instead are aggressive buyers and sellers, people actually willing to eat that liquidity. We call these market makers and these market takers. And if you actually start studying how the interaction of these buyers and sellers unfold in this type of auction, you're gonna open your mind on how markets actually work. In this video, I went even deeper on how this works, and this is basically all I talk about in this profile, so you might want to follow.