The SECRET Timeframe NOBODY Uses🚨

22 Jul 2026 · 0 min
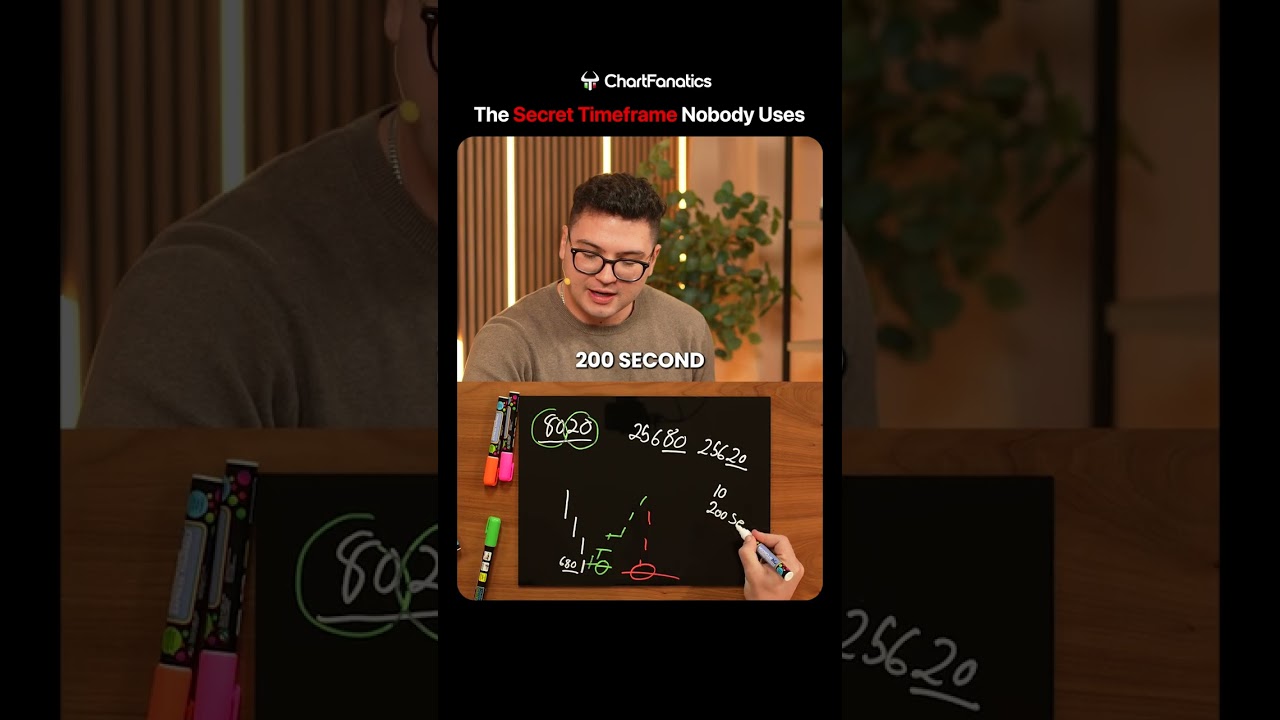
0:23

In this brief segment, the presenter introduces a non‑standard intraday charting technique that pairs a 10‑minute chart with a 200‑second chart. The 10‑minute timeframe is used to assess the overall market structure, while the 200‑second chart subdivides each 10‑minute bar into three equal segments, providing a finer‑grained view similar to the conventional 15‑minute/5‑minute pairing. The speaker explains the reasoning behind choosing 200 seconds and positions the method as an alternative to the more common 5‑minute and 15‑minute dual‑timeframe approach.


More from Kardec

0:42
youtube.com

THIS Short Strategy Makes MILLIONS🚨

1d ago
1:22
youtube.com

Trading strategies tier list

1d ago
14:02
youtube.com

The Ultimate Risk Management Strategy for Profitable Trading

2d ago
0:31
youtube.com

You Want to Live Off Trading Tomorrow?

2d ago
0:40
youtube.com

NEVER Trade Pre Market Open (MUST WATCH)🚨

2d ago
0:38
youtube.com

Simple volume bias

2d ago
27:30
youtube.com

i am not your f**king trading guru

2d ago
0:43
youtube.com

The MAIN Reason MOST Traders LOSE🚨

3d ago
0:31
youtube.com

Why people want to believe in lie ? 

3d ago
0:22
youtube.com

WHY Trading NEW Firms Is The BEST Move🚨

3d ago
0:22
youtube.com

By favourite PRO trading Tools.

4d ago
See all content



