The Simplest Day Trading Strategy for Beginners (PbD Method)
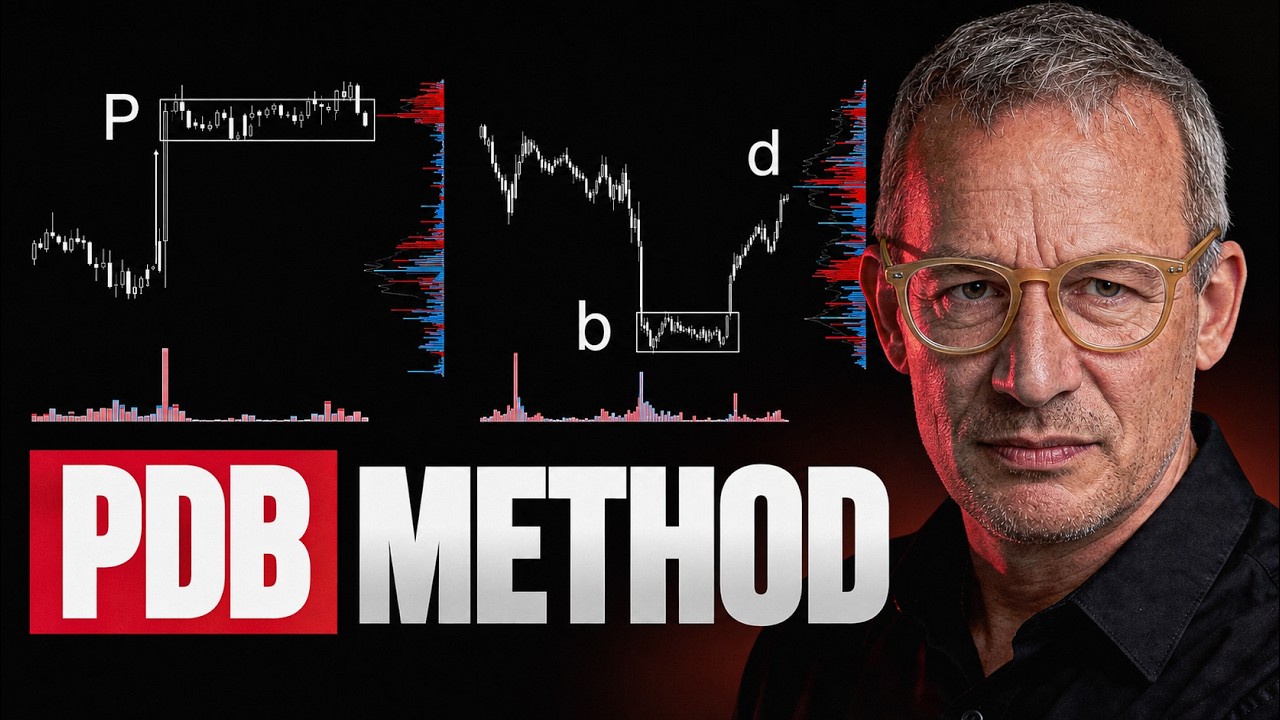
Kardec Trader explains the PBD method, a day-trading strategy that skips indicators and focuses on closing prices and candle bodies. Markets alternate between sideways phases where institutions accumulate liquidity and trending phases where prices move fast. Entry signals come after a clear impulse follows a sideways period, especially during month or quarter starts.
Chapters
Most trading beginners think that trading is complicated. Yet, there is a day trading strategy that is so simple that you'll understand it on the first day. The PBD method. And what I'm about to tell you now, you won't believe me. But it is exactly the basic logic with which my student Patrick Neal became a 2-time trading world champion. In this video, I'll show you Why you no longer need indicators for your strategy. The 3 formations of the PBD methodology.
The exact strategy for the best possible market entries.
And how you can read any chart today without any real prior experience.
Most beginners think that trading is just super complicated, but there are also strategies that are really relatively simple and very logical. And this is exactly the strategy I want to introduce to you today, because it's a technical derivation of many complexities. And it's exactly with this strategy that many of my students started and were able to adapt this way of trading for themselves without getting all those thousands of pieces of information mixed up. Because that's what unfortunately happens quite often. And that's exactly what we're going to take a calm look at now. I'm going to show you how to implement the whole thing for yourself without indicators, indicators using the PBD concept. But first, let's take a look. What is it exactly? Let's dive right in and take a look. What exactly is this model? And first of all, I want to show you that this here can be any random chart progression. For example, a line chart like this. Yeah, and now the question is, what happened there? What information does it give me? And with the PBD concept, you can narrow down exactly where there was momentum in the market. For example here, for example here, and where the market was more in equilibrium, like there and also here. So that's the first thing we need to understand. We distinguish between active trend structures, where markets are in imbalance from a supply and demand perspective, and sideways phases, where the market is in equilibrium. In the second step, we naturally need to know, how do I even come to say that this is meaningful in any way? The logic behind it is that in these sideways phases, a relatively large amount of liquidity is usually gathered, and in such a fast market phase, relatively little liquidity can usually be traded at a single price level. What does that mean for us? For us, it simply means that we can make an assumption that for the most part, in these sideways phases, markets are able to conduct their business in peace. That means entering positions calmly and at relatively constant, fair prices. In the second step, this means that in these fast market phases, it's very difficult, for example, for a seller to be able to sell at a predefined price level at all. And then in the end, this trader has to sell at prices that might seem too expensive to him because he might have wanted to make his sales at higher prices instead. And that is what is happening there. This means that in Phase 2, where things are getting faster, a seller— or if it goes up quickly, a buyer— doesn't have the opportunity to place something, um, on the market at a predefined price range. And that's why large traders naturally really like these sideways phases, because if they want to place a lot of liquidity in the market, like right now, for example, on the first or second of the quarterly opening season, there are inflows of funds. They naturally have more of an interest in doing the whole thing in a solid market phase where they can get their stocks or whatever product they want to buy at a fair price in peace. If the market now, as is happening again right now, and this often happens during such market phases, moves very quickly in one direction upwards, then they have to buy at a high price. So that's the first thing I'm basing the whole concept on in terms of thoughts. Now let's take a look at the whole thing in a chart and start by differentiating a bit between sideways phases and trend phases. I'm just doing this very sporadically now so that you get an idea of what I'm talking about. Yeah, and you can already see that there are many sideways phases, but there are also these rising phases where it becomes more difficult to localize when does the market actually actually go long and when does it go short? That's why in the PBD concept we don't use the absolute high and low points, but we always look at the closing prices and the market openings, because we simply claim that in this phase here the probability is higher that the market has been running sideways for a while. You will see this especially if you examine larger time frames, that often most of the turnover took place within such a body, that is a candle body, and many turnovers that took place in the spikes were characterized relatively quickly by rejection or rapid sell-offs. So that's the next thing that's very exciting and important for me, and we're going to investigate that a bit now. Namely, in this move I was just talking about, we have the beginning of the month here again. We have inflows of funds, and you can already see it here how the liquidity down here is also increasing, and the market is slowly starting to shift its price ranges upwards. So you can see that there is also a buying surplus. Now you could say, yeah, great, you could have traded the breakout here. Yeah, it always looks so easy. But if we're honest and do the following for ourselves and say we wait until a real impulse has arisen, and a real impulse always arises when no large pullbacks take place, but it goes straight in one direction or the other, then we have the possibility with point 2, and that is the most crucial thing, a subsequent to identify a sideways phase for us. You can see that really well here, for example. Yeah, then we have what's called a P profile, which basically tells us there was a market imbalance on the buy side, meaning more buyers than sellers. In this case, the whole thing is also backed up by logic. There were simply inflows of capital.
Before we get back into it, a quick notice: World Class Edge just launched. And if you want to know how really institutional traders and market makers actually trade, click the link below and secure your spot at World Class Edge.
Alright, back to it. As I said, at the start of the month and the start of the quarter, people love to buy on the stock markets. And now I have the opportunity to identify that the market is also accepting these higher prices with liquidity. This means that major market participants accept this price level and are then in the process of building up or reducing their positions within this price level. We don't know that yet, it's just a preliminary assumption for now. Now, in the next step We're going to take a look at the whole thing from a more conceptual perspective. Now we have a P like this, and this P now gives me the opportunity to say, yes, I see there's a sideways phase. And within this sideways phase, I now have a higher probability for the time being that it will continue to go long.
Why?
Because the acceptance, or rather the corresponding liquidity, has taken place up here. The profile, if you were to look at it as a volume profile, meaning how much turnover occurred at the corresponding price ranges, it would look something like this: relatively little turnover and then a lot of turnover up here. And now we move on. If the market now decides to break out upwards again from such a sideways phase, ideally at the closing price, then our initial assumption is that the trend will continue. So this is a trend continuation that is clearly supported by strong liquidity because the markets have pushed up and have accepted higher levels of liquidity. And so this concept is perfectly suited to say that if the market now comes back, as shown here in the chart, to this old liquidity, I'll initially assume that it will continue to run. Why do I assume that? Because it told me up here. I'm now accepting a breakout, and as soon as the market also generates liquidity up here, I have proof that higher prices are now being accepted. And so this sideways phase here, with a higher probability, is very well suited for speculating on a trend continuation, as it signals to me up here that it's again accepting higher prices, and it told me down here that the market is now shifting into an upward imbalance. And that's what I based this concept on. And now let's take a look at the whole thing in a bit more detail. Look, my first glance when I look at a market like this is always, where is there dynamic movement? I see it immediately here, here. Then the market made a trend here, made a trend, made a trend, made a trend. That's what I see right away. And if we examine this a bit now and make it really simple, then I can say the first thing we always need is momentum. So now I have momentum and see higher closing prices. So I go through my counting method and say it ends up here because now lower closing prices are coming again. And so I can define a range here and say this is the sideways phase that has now taken place after a dynamic move occurred. Exactly the same can be done here. Momentum and sideways phase. And from here, the counting started again. It's going up. This is where the counting first began. Here we had a so-called break-in. You can also see here how the market accepted that. But let's keep it simple. The logical result of that is then that the market continues to trend down here. The logical result is that the moment it accepts these levels best via closing price and sideways phase, there's a high probability the market will continue. And look, you can see that very, very clearly, that at a later point in time you could have traded a quick breakout here, and then at a later point it tested up here again. And when it does this test, the probability is just good if it has a rejection there, like here. And then it very often continues further down. That means if I can locate with my eye where there was real acceleration, then I can subsequently conclude that these are interesting price areas for me for now. You can see that here too. It bounced off here and it bounced off here. So you have to develop the ability to select for yourself via this concept. Where is the dynamic impulse? There the market is in imbalance, shifts its new acceptance into a new price range, and then very much likes to test this price range. So now we have an idea for a P, an idea for a B, and those are the two structures that I like very much when it comes to faster moves. And now we come to a D. And what is a D? A D is always the price range where a market, for example like here, first moved dynamically, and then you often see it and it starts to form a sideways phase. And this sideways phase can be defined here, for example, in this way. And the D area is the area where a market plays up, down, up, down again and again. And we can see that a large sideways always phase emerges there in the end. This is valid until a previous price range is traded away extremely to the downside again. And now I'll show you something, and it's very, very cool to see what happens when the market has had a long D structure. Take a look. It then really likes to run back into this fair price range. And although it had acceptance down here, the market likes to run back impulsively into such a D and then plays its balance game again. Yes, that means this is where the greatest liquidity was. And here I can see if I find shorts at the top again, longs at the bottom, short top, long bottom, until, for example, a strong impulse up or down removes this price range again. And here you have the opportunity not to continue the trend but to play the game again and again with so-called counter-trading, i.e., trend reversal setups. And this logical consequence always takes place when, for example, large market participants absolutely want to root their orders in this price range. They ensure that the market jumps up or down again. And so, to summarize, this whole concept of P, where power is generated, B, where the market generates exactly this weakness, and a D is a beautiful interplay where different trading characters can trade. Here, trend followers who like it when markets run bullish for a long time, for example, can locate their nice trades accordingly. Here, especially breakout traders who like it when things go fast and massive can place wonderful trades in these weakness phases. Long traders can too, but often it goes even faster short. And if we see that these concepts fail here, meaning we get stop losses and the market runs back in and back in, then we usually have a larger balance game to expect. And then we can look for the counter traders to see which concepts are effective for them there, because that's when a so-called sideways phase often occurs. And you have to know, sideways phases make up about 70% of the market. All those fast market phases, where the high-performance hit rates occur, are mostly found in the so-called P&B concepts. And it's just great when you can localize that and plan it very cleverly for yourself. It's been a pleasure presenting this to you, and we'll see what else we can provide for you. Have fun with it!









