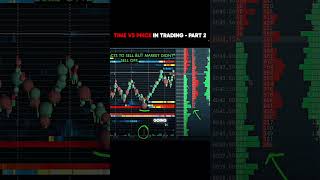
Kardec Trader explains why bearish-looking charts can still reverse. Even when price shows lower highs and lows, passive buyers stepping in at support levels can overwhelm selling pressure and trigger rallies, regardless of what the chart structure suggests.
Questions this video answers
258 contracts.
100 contracts; 149 contracts; 217 contracts.
Chapters
In terms of technical analysis, the market just placed a lower high, it's putting in lower lows. And a lot of traders would consider this very bearish in terms of a trend, especially that call it, we just broke, let's just say a trend line as well. When you understand the driving mechanics of the market, this period of consolidation, there's going to be buyers factored in there. This is our context, this is our location. Now we can look at our confirmation as look at this aggressive seller aggressively selling, hitting the bid to somebody who is passively buying here. The market then bounces. If the selling cannot take out the passive buying, then the market will have to bounce and rallied to the upside. And even going into the order flow, we see the selling volume. There was 258 contracts to sell here, yet the market could not even sell off directly above it. Look, 100 contracts, 149 contracts, 217 contracts. There's significantly more volume at the low than there was on the volume on the sell off. Yet despite the high volume here, the market cannot move down because there's a larger passive buyer supporting the market. And this is where support comes in and this is where the reversal happened.