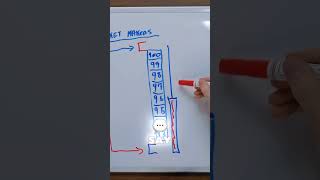
During major economic releases like NFP and CPI, liquidity drains from the order book, forcing traders into wide spreads and sharp price spikes. The market hunts for remaining limit orders, not stop losses, leaving distinctive patterns on footprint charts that signal true liquidity voids.
Chapters
during CPI, during NFP, during FOMC. A lot of people doesn't know it, but this is exactly what's going on behind the scenes. They will delete this liquidity from the book and they will just leave it at the market. So there might be one sell limit here, super high, and one sell limit here, super low, because no one is willing to be a market maker here, neither the firms or other traders or HFTs. And these are maybe normal traders, let's say some random orders here and there. Now, if you want to buy market, you're going to be filled here, right? The spread is wide. The spread between bid and ask, best bid and best ask is wide. So if the candle was here, what will happen? Kaboom. So the first movement might be that one. And then I might sell. And where will I get filled? I'll get filled over here, wherever there's at least one buy offer. So the candlestick at this point will completely reverse, leave a big spike above here, and turn red. And ICT traders will say, see, they hunted for stop losses, you know. And it's stupid because they're not really stop orders being triggered, because these are the stop orders. Buy markets and stop orders are the market takers. What the market is really hunting for is limit liquidity. So it's the other side of the spectrum. It's not hunting for stop losses, it's hunting for limits because we need to get filled now. That's all there is. And if you're going to see the footprint of a news event like this, you're going to see maybe one here at this case and you're going to see 000-000-00001 and you're going to see what we call a liquidity void, the real liquidity void. Because there is literally no liquidity, there's no market.