THIS Chart Pattern Makes MILLIONS (MUST WATCH)🚨
16 Jun 2026 · 0 min
0:28
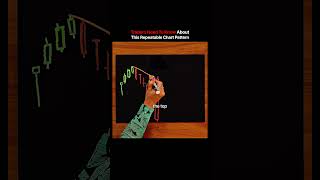
In this instructional segment, the speaker demonstrates a repeatable chart‑pattern technique for traders. He explains that you first locate the candle with the lowest low within the pattern, then draw a vertical line from that low up to the top of the prevailing trend line. The price distance measured (e.g., $20) is used as a predictive metric: the next downward move is expected to be roughly the same distance. This measurement‑and‑projection process is presented as a recurring, reliable signal for anticipating further declines.









