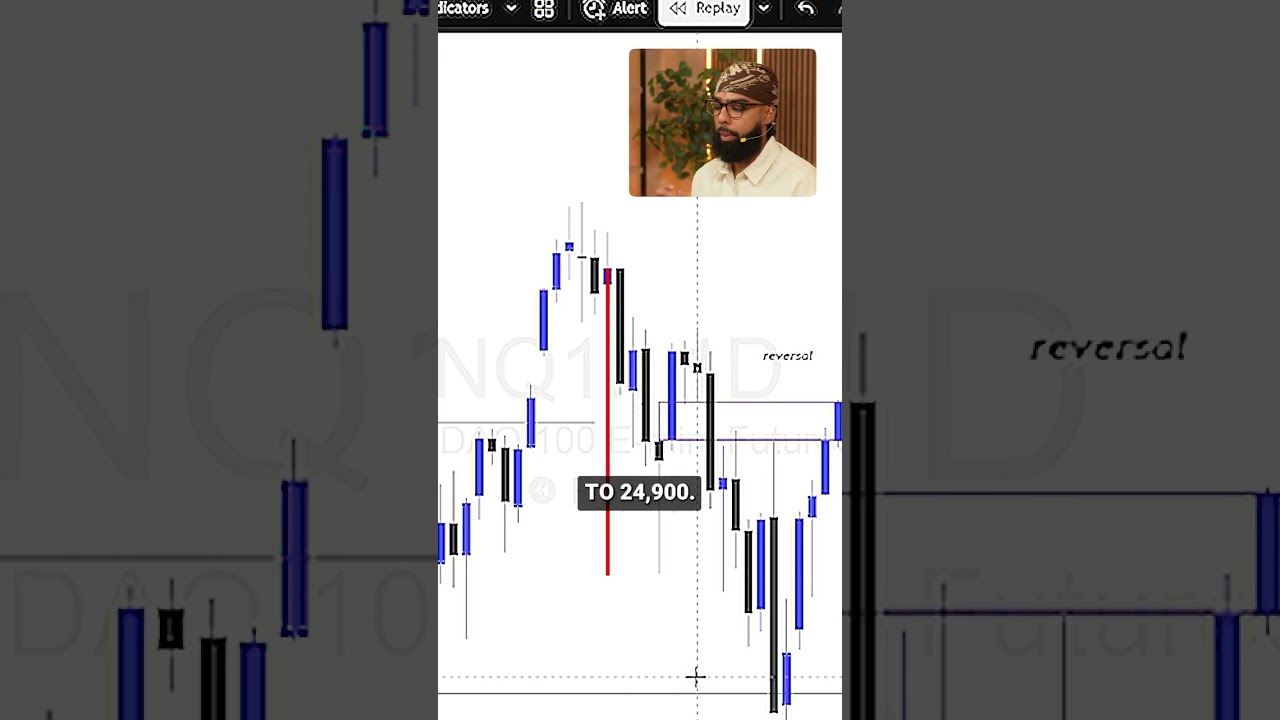
Kardec Trader explains how to trade price gaps, using a recent example where the market dropped from 26.4 to 24.9. He waits for a daily candle rejection, then enters when the gap, liquidity, and candle pattern align as entry signals.
Chapters
When we see a gap like this, this automatically, my mind is like, we're going to come back and fill this because this is the highest probability draw there is in the market in general when it comes to having gaps like this. And if you guys compare this after, it looks very similar to what we have here. And as you guys can see, we basically came down and we had a massive sell day. We filled this gap. To me, that's still not enough because I want to see these gaps here get violated or any ones that we create to the upside. We actually came all the way down from here, all the way to 26.4 to 24.9. But what do you notice? These lows are still intact. So in my eyes, this is our sell side liquidity here. We have a rejection on the daily candle, right? We came all the way down and we reversed back up. What is happening during this reversal? In this case, it's all on the daily time frame. We came back up and we rejected back down. We left a daily bullish fair value gap here. And then what do we do? We inverse it. This is where, after days of waiting and waiting and waiting for this move, this is where I strike. This is where I get interested in the market.