THIS Will Improve your Day Trading | How to Use Gamma Exposure | lesson #2
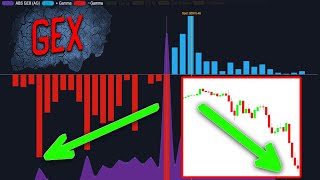
Kardec Trader explains how to use gamma exposure to find support, resistance, and breakout targets in day trading. The strategy favors breakouts moving into positive gamma or accompanied by rising gamma, and avoids trades where gamma falls. Real examples from SPX and SPY show how to build gamma levels and spot high-probability setups.
Questions this video answers
January 3, 2025
March 6 (year not specified in the transcript)
Chapters
With these videos, you will learn to understand the gamma exposure profile, learn how to build gamma levels, what signals they send us, understand what primarily affects price, movement, and learn how to make money from it. In the last video, we looked at a signal that will indicate that you can safely take a long or short position. In the same video, we will look at a signal that will indicate that you can open a long position to break through the resistance level and a short position to break through the support level. Well, let's go straight to specific examples because it will be clearer this way. On January 3, 2025, at the opening of the gamma exposure profile market, it looked like this. We see that the maximum values of negative gamma passed at the level of 5,900 and the values of absolute gamma were located there at the same time at the level of 5,915. This is where the price was at that time. We see quite large positive gamma values above the 5915 level. Positive gamma begins to fall. However, it cannot be said that the bull's interest is drying up above the 5915 level, because the values are quite confident and we don't see the situation that the higher the price, the lower the gamma exposure. Moreover, Starting from the 5950 level, Gamma is even growing. What primary conclusions could we draw? 5900 is a very powerful support level, which, taking into account the values of absolute gamma and negative gamma, was perceived as a strong support that should keep the price from falling. However, we also understand that given the significance of this level, if it breaks down, it will definitely not be false. That is, it will be based on some circumstance that will prompt market makers and major market participants to switch to a sale. Perhaps a breakdown of this level may occur due to the fact that some negative expectations are being realized. For ease of understanding, imagine that at the beginning of the day, market participants know that there will be some kind of event today which under unfavorable circumstances can have a negative effect. What kind of event it is and whether it is being implemented at all is not important to us now. The important thing is that we already see in advance that they will fight for the 5900 level. They will try to keep the price above it. But if the breakdown takes place, we know the levels to which the price may fall. On the other hand, when the 5915 level broke through, we could single out the 5950 level as growth benchmarks, which is the second largest surge in absolute gamma and an even more ambitious target of 5,965, which is a large positive gamma value. That day I wrote that for SPX, 5915 is resistance and 5900 is support. Going above 5915 will mean the price moving to positive gamma exposure with further growth to 5930 and further 5950. Leaving below 5900 will open the way to 5885, 5850 and then you can focus on the large negative gamma value. At the moment the price is in the decision making zone. And here you need to look at the exit after the fact. If we look at the SPX chart, we can see that the day started with growth further. The price traded for two hours between these support and resistance levels. But when the resistance broke, the Price reached the 5950 level during the day and the day closed not far from this mark. And here's a little life hack for you. When you see a situation where, all other things being equal, there is an equal chance of a breakdown of the support or resistance level. It is better to always expect an exit to the top. I mean, if the price had decided to fall that day, it would not have been surprising for us since we already understood at the beginning of the day that there were levels below that could attract the price. If we hadn't seen the positive gamma rise above the resistance level that day. To put it simply, if the blue bars hadn't been growing and if we hadn't seen the absolute gamma shift to positive values, then yes, we could have said that the advantage is going towards the bears and it would be more logical to expect a decline on the same day. The situation was basically the same. That is negative gamma was slightly more than positive, but this was offset by the fact that absolute gamma prevailed in the territory of positive gamma. So in such a situation it would be more correct to expect a move up. Because historically, all other things being equal, if there is no apocalypse or nuances that should cause the market to decline, then the price will always tend towards positive gamma exposure. This is confirmed by the vix. Sometimes it grows a lot in a panic, but it always tends to the minimum values. Another example of how you can trade for a breakdown is the gamma flip zone breakdown. That is, this is the point where gamma exposure changes from negative to positive. This level will always have a very serious significance and if it is below the price, it will be perceived as support if it is above the price as resistance. As an example, we can consider the situation that unfolded on spy on March 6th. At the beginning of the day, the price approached the gamma flip level and large positive gamma and absolute gamma values also passed on the 580 strike. And all these values are located like this on the chart. The 580 level was perceived as resistance. Well, you can read the post that I wrote at the time that according to Spy, the nearest resistance of 580 beyond this level begins positive gamma exposure. If there is a breakdown of this level, the path will open to 585 and then 590. Well, I noted once again that so far this is just resistance. As a result, that day the price could not break through this level. It went to test a strong support zone that was at 570 as we traded this day. I will tell you in the following lessons. The day was really interesting, but the point is that even though the price that day could not go higher, nevertheless the resistance level was determined correctly and the price struggled into it for a very long time. But most importantly, we understood that we can enter a long position only under certain circumstances. To consolidate, it makes sense to open a long position for a breakdown. If there are large positive gamma values above the resistance level, large volumes on call options or large absolute gamma values, we can focus on these values as a growth target for where the market may go in the event of a breakdown. The more the value is centered around a single point, the stronger the signal is obtained. I mean, if for example, the SPX is at around 6,000 points and there is a resistance level at around 6,010 points, large positive gamma values are at the 6,060 strike and absolute gamma is there. Then if there is a breakdown of 6010, this level can be perceived as a growth target. The second option, when it makes sense to open a breakout position is if the price overcomes the gamma flip level followed by an increase in gamma exposure values. That is, if we are talking in the context of long positions, if we see an increase in positive gamma during a breakdown of the resistance level, then it will be stable to open a long position. If the value decreases, then it is better not to enter the position here because this may well turn out to be a false breakdown. Similarly, only in the other direction. All this will work when it comes to the breakdown of the support level followed by a downward movement. In conclusion, I will answer another question that may arise and where to get all these values? All this is on our website. All members of our community have access to it and there you can look at these parameters in real time and not only using SPX, you can watch shares of ETFs and much more. And on this site, in addition to the parameters described above, there are also graphs on which these values are plotted. And there are graphs that show key support and resistance levels. But we will have a separate lesson about this later.










