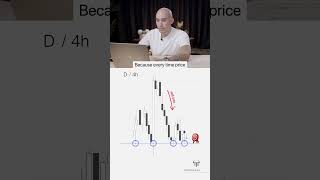
Forget traditional indicators. Find where stop-loss clusters sit, then trade the sweep between them. A level that holds on the daily chart is a sell target because buyers stack stops just below it. The market moves to capture that liquidity, giving you the entry.
Chapters
You don't need indicators. You need to know where liquidity is sitting because the market doesn't move based on your RSI or your moving average. It moves to grab stop losses. And if you know where those are, you know where price is going. Most traders are taught to find a key level on the higher timeframe and buy it when it holds. I do the opposite. When I see a level holding like that on the 4-hour or on the daily, I'm not looking to buy. I'm marking that level as a target to sell into because every time price bounces off that zone, more buyers enter, and every one of those buyers places a stop loss just below it. Now I go to the lower time frames and I look at the other side, the highs. And what you'll usually find is price tapping into the same high over and over. Every tap is pulling in sellers who think the high is going to hold, and their stop losses are building right above it. So now I have two levels: a low on the higher time frame and a high on the lower time frame. The market is going to sweep one to reach the other. Once that happens, I have my entry. I sell right there. My stop goes above the extreme and my target is the level on the higher timeframe that everyone else is still buying at. Key levels aren't places to trade from. They're places the market builds up to take.