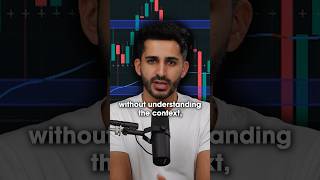
A short trading tutorial (YouTube video by Kardec Trader) explaining how to use footprint charts together with broader market context. The speaker stresses never to analyze a single candle in isolation, and to identify significant historical supply/demand levels (e.g., levels cited as 45 and 85) before using footprint data to make trading decisions.
Chapters
We never want to look at an individual candle without understanding the context, without understanding the session, without understanding what is happening from a larger picture. So, for example, this level 45, 85, may be a massive supply level that we're going into. Maybe we might be into a massive demand level. So our job, once again, is very important to identify these zones, these levels that we're watching, and why we're watching these levels. If I was to just look at this, these levels have played a significant role. Even if I go back here, right. Even this level, just, just for Conte purposes, has played somewhat of a significant role. So going back in history, looking at the significant levels and understanding the context. Right. And putting that context together with footprint charts is a, is a great indication of understanding the market.