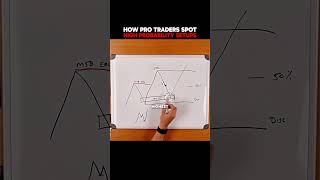
A trader explains how to find high-probability entries by identifying internal liquidity zones where other traders have shown interest, then confirming them across weekly, daily, and hourly charts. This filters out noise and stops you from exiting early on minor pullbacks.
Chapters
All the trades that you take here are going to be so much higher probability. Whenever you've had examples where you're like, okay, I'm trading and I made a pullback here, I longed it and then did this, and why did I get stopped out before the actual move happened? This is going to help you avoid that, because in here there's going to be little bounces, there's going to be little pullbacks. You might think it's reversing and it might, but the highest probability trade is going to occur back at this internal liquidity level, back at this point of interest. And if you just focus on this, you simplify all that other noise you're looking at and you say, okay, this is my weak weekly chart or this is my daily chart. Great. Now this is the daily. We're going down here on the H1 and we're now actually going to go look for our entry.