Using Orderflow to Make $4000 in 1h
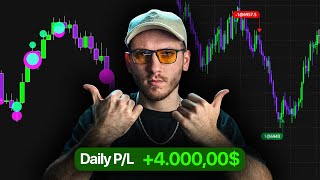
A trader shows three live S&P 500 futures trades that netted $4,000 in one hour using order-flow analysis. He uses volume profiles, bid-ask footprints, and cumulative volume delta to spot where banks and smart money are buying or selling, then trades reversals and breakouts when price fails to absorb that volume.
Chapters
I've made a little over $4,000 trading the S&P 500 futures in a single session using order flow. I will show you exactly the strategy I have used with an exact trading breakdown. So the first thing I do when I open my computer is open my Deep Charts platform and have the one minute chart on this side and the five minute chart on this side. On the five minute chart I typically have these big bubbles that are the big trades taken through the order flow of the entire futures market filtered by size so we can filter out the noise and just see the big trades from big banks, from the smart money. The trades actually matters. And on this side instead, I have a more, let's say old school type of footprint chart. Your very classic bid ask footprint chart where you can see the numbers, the nitty gritty details, all the statistics of each candle with the deep stats and the cumulative volume delta. I also keep typically a volume profile on this side and this is my basic setup. You can find it here on the templates of Deep charts. Full version. Andrea CME ES this is the 5 minute on this chart and this is the 1 minute template on this chart. But before we see the actual trades that I've taken during this session, you might want to see, Hey, I don't want to only see the chart. I want to see that you actually took these trades in a real account in the real market. And that's completely true. So first I'm going to show you that I have actually executed these trades. I'm just going to log out for a second from my thinkorstream platform and I'm also going to log out from my brokerage and re log in just to make sure we're talking about the same thing. So let's re log in. Let's not make any cut here, editors please. And so they can see it's all real and we're not faking anything. And this is my real account. I'm not a prop firm trader anymore. Since probably at least two years I haven't been trading prop firms. I use my money. I basically trade it kind of conservatively because I want to grow my money through time and I don't use trading necessarily as a cash flow business. But still, I've deposited 50k in September, managed to put them up at around 65, $66,000 in a matter of what is it like 2 months, 1 month and a half Then November was a very high drawdown phase. I probably lost, I don't know, around $6,000, not much. And I Didn't trade throughout all the entire winter because I was doing holidays. And then I've deposited 75k and then 75k more. And on January 26th I started my trading once more. And as I promised to share a little bit of, you know, my journey through trading, the good, the bad and the ugly, I want to transparently show you my exact track record. And I'm going to do it more times inside of this channel for transparency purposes. So if you appreciate that, join the community by subscribing to the channel. And so starting January 26th, for now, starting at $209,000, we've been going up until 217. Well, I've taken a screenshot just in case. These are the actual trades. I've taken the screenshot on the same day, but you can see them clearly here. That's exactly the trades that I took. And now I can show you why I've executed these trades and go to the actual breakdown of the trades. Let's go and understand how I frame my entries. I'll typically start on a five minute char and what I want to see is where is most likely price is going to stay throughout the day or what's the most likely path for the price and for the auction throughout the day. And to do that I use volume profiles. I use two types of volume profile, the most important one being for framing the bias, my composite volume profile. And this composite volume profile basically takes the entirety of the volume of the chart that I have loaded and I typically load the last 10 days. And what I can see is we have a double distribution. So this is a first distribution and this is a second distribution. We have a low volume node right over here. And that's going to be a crucial point and I'll explain you why in a bit. And the second thing I'm looking is how is the previous cash session profile unfolding? So this dark orange one is the volume profile of the regular trading hour session, the so called New York session. The Asian and the London session are in this lighter color because there's less volume into those areas. These are the ETH or extended or electronic trading hour session. And then again this is the session I've actually traded. We have another volume profile because that's the next New York session, as you can see from volume. So since yesterday in the last session this was the main fair valuation and we are in a fair valuation area where most of the money has been traded over the last sessions. Then this, I consider this to be a very strong area of Comfort where price is likely to be keep trading. Because already 70% of the trading activity happened within this range in the previous session. So what I want to see is one of two things. We either break out from this area, so aggressive buyers are not considering these prices to be fair anymore and instead consider higher prices to be the new fair valuation of the asset and not just with an impulse. I don't want to just see an impulse during the breakout. Basic market structure is not enough. What I want to see is a range being formed outside of the previous day valuation because that will tell me that both sides of the auctions, both the aggressive seller and the aggressive buyers, consider this to be a fair valuation of the asset. Because just the face of price discovery doesn't mean price acceptance. This would be only price discovery. This is price acceptance. So in order to qualify a breakout, I wait for a range to form and I would like to see this range formed either outside of this range or inside of this other distribution. And as we open our session right over here, the first thing price did was pump up. And I was genuinely waiting for a breakout. Right. But then as traders, we adapt to what the market tells us. We don't need to marry an analysis, we need to adapt our idea as the market gives us new information and we want to align ourselves where the biggest flow of money is already. A very important piece of information I can see is where did we open the session? Well, we opened the session exactly inside of the previous value area. This is already a good sign that we're probably going to stay inside of this range for the rest of the day because there was no relevant news or price discovery auction during the Asian or London session. And we're about to open the session exactly when where most of the money was traded yesterday. So if from here again we move outside and we create fair valuation, then I'm looking for longs. But for now I have more information that I'm probably going to look for bouncing from this area or from this area and wait for an order flow pattern to unfold over here where I can see buyers being absorbed and you can kind of already see it now with the big trades. Let's zoom in to understand what happened. So right at the top of this area we had buyers above genuinely trying to push the auction up and up and up, but they were absorbed by seller in all of this effort. They put a lot of effort into trying to get out. But sellers consider these prices to be very interesting to sell for them way more than aggressive buyers were. And the Auction has been pushed down. The first trade idea happened around here where we had the first fail, breakout to the downside. So this was my first trade idea. I saw this was the initial balance and we had an attempt that already failed, another attempt that already failed. So I know that this is already fair value. We're in a ranging market. So the first idea I had is when I saw these aggressive sellers being absorbed at the bottom. It's simply the same thing that happened over here, but from the sell side of the market. And that's when I drop into the lower time frames. And that's when I drop into the lower time frames. And let's see what exactly happened here and made me pull the trigger on this exact candle over here. If we zoom in, we can clearly see there was a lot of effort. Look at the numbers over here. 3,000 contracts, 5,000, 8,000 contracts. A lot of sellers over here. And I can see those thousands of contracts being absorbed over here. And right after a very strong volume reversal, this is very crucial for me. A strong low happens when, when we for example, break out with a lot of volume. 5,000, 6,000. You see volume here increasing on the way out, but then also increasing all the way up. Back inside of the range, we still kept a very strong pace. 6,000, 6,000. When I saw this huge volume and I started seeing sellers also from the CVD being absorbed. So you have a negative delta with a positive price action. That's a very clear divergence in market pressure. There is an effort from seller that is not having any follow through. And the five minute candle was about to close right over here. And that was my signal for the entry. I have a clear absorbed seller. This stuff, you cannot see it with price action, unfortunately. And then I traded all the way to the other side of the range where sellers are likely to get aggressive. And as you can see, that's the trade being closed over here. So we open the trade over here, we closed it over here. And then I simply waited for this thing to happen here once more. I saw a lot of aggressive buying. To be honest, I was waiting for this level to be broken above with a very strong candle, a lot of buyers and maybe trading an opening range, breakout type of setup. But what happened again is buyers very aggressive at the top of the wick, completely reabsorbing the price action. And then I zoomed in again into the nitty gritty details. And I can see again exactly the same thing during the breakout. Really high volume. We had 3000 contracts averaging the previous candles and then 5000, 6000 and then again 3000, 4300 on the way down. And I think this is where I said, you know what, this is a very good sell idea. Because the auction is clearly telling me without a shadow of a doubt that the party is not going anywhere on the upside that the money is not ready to go up. They told me this with numbers in a very objective way. We had a very strong rejection with a lot of volume. The buy candle had little to no volume. 3,000 contracts, that's negligible stuff. And instead, as we broke back inside, the activity started rising. Buyers and sellers start auctioning very aggressively again on both sides of the auction, but with a clear selling dominance. 4,000 contracts. 4,000 contracts again. So the party is going inside of the range once more. The fair valuation is still this one. We're not ready to break out. This is a clear failed auction. And that was exactly the second trade. I've probably opened it already here. As I saw the candle reabsorbing stop was likely somewhere above here. And we took profits around the beginning of this candle. So probably somewhere around here. And that's already another one to four risk to reward. Why did I take profits so early? Well, because the beginning of a strong impulse happened here. And that's typically a very strong area for a buyer response. We had big buyers on this candle with the candle closing within the big trade. A lot of low volume areas, which is, you know, pure momentum, pure buying pressure. So that's where I want to be out where I have a risk that buyers will take control again. And as you can see, they kind of did. Right. They've consolidated into this area for some time. And then we finally had the breakout that I was waiting for. Look at this breakout. We broke the opening range with a strong sell candle. Big trades inside of the candle, which is a very crucial point of information for me. Another sell candle. And look at this. What happens to the volume when we break out? Do we have a dry up in volume immediately? No, we have a lot of volume in this. The party is going down. Okay, so what I wanted to see now was from this area, from the sell zone value being created inside of the big range. This is exactly what happened. We had a very strong momentum down a lot of volume here. Small failed auction above here absorbed buyers on top right over here. I can already see it from the candles. But if you see right here, there was a very weird exhaustion movement from buyers where they tried to buy up, but they got completely rejected. So how I frame These type of entries is I take my volume profile from the top to the last of the range and whenever I see on this short term bearish value area, I want to see a breakout of this level. And when I saw it, I think it was right over here. Yes, that's exactly when I saw this breakout on the test. I think I've executed my sell trade and I've exited and took my target after this big bearish leg of price. So basically took this movement very short term. I could have honestly taken another short trade over here and it would have been a pretty successful trade. But I was pretty much done for the day. Three trades perfectly executed, no need to force the hand anymore. I just got the fuck out of the market. But ultimately we reached the final target which was the other side of the previous day value area. So to summarize, we had a range. The first idea was aggressive. Sellers absorbed buyers taking control. Let's head to the other side of our range because that's where most money is being traded. Secondly, buyers being absorbed at the top. Same thing. Let's sell until the other side of the range, more or less. And then let's wait for a strong breakout where a clear auction is unfolding and wait for a breakout of this area to go to the other side of our main value area, which would be our value area low. So two setups were reversal trades. One setup was a continuation trade. But always following the money, always following order flow and reading the auction in real time without any preconception, without any bias, just objectively looking at where the party is going and where the money is telling me it's going. I just simply join the party. They show me the invitation. So I don't need to force trades. I don't need to guess. Whenever they show me the invitation, I join or I choose to not join. I hope this video gave you some value. Let me know in the comments if you want to see more of this trade breakdown videos. I'll keep you posted on how my real account is going. So subscribe to the channel and I'll see you in the next one. Ciao.










