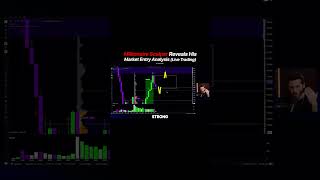
A trader explains why breakouts fool most people: they focus on price instead of order flow. Watch for absorption of sellers, contract volume shifts, and the Initial Value Bar to spot real breakouts versus fakeouts that reverse at the opening range low.
Chapters
Now what I want to see is a low to be plotted somewhere around here, or it can be this one as we've again rejected with aggressive sellers being absorbed. This potentially being the beginning of a consolidation area that I'm going to fade the shit out of. Specifically, I would like to look for more longs right below here if they reject again, more sells from here, the next rejection. And whenever there's a strong convincing breakout, then I might engage for a continuation setup. We're now touching the test of the IVB. We got a bunch of aggressive sellers here getting absorbed. You can see it from here. If buyers engage, I might start considering to fade back the high. For now, this is a strong breakout. See, today we had one fake out below the opening range, another auction that now completely reversed. We exited at the right time, in my opinion, but I'm still not convinced that this is going to be a complete reversal because order flow is not telling me this. More aggressive sellers, 5,000 contracts. If this is a low, it's a strong low. If we're breaking back inside, then it might be a complete reversal. I might choose not to engage at all.