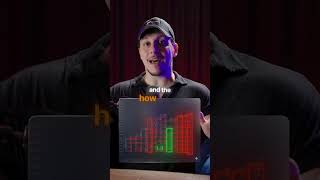
Kardec Trader, four-times top-ranked in the World Trading Cup, argues that order-flow candles reveal institutional orders and trapped traders before price moves. A 2014 study on over 50 stocks found order-flow imbalance predictable. He says this edge beats traditional candlestick charts.
Questions this video answers
Four times.
2014.
Over 50 stocks.
Chapters
Stop using normal candlestick charts and use orderful candles to boost your edge. Here's how to do it. But before you question my competence, I'm four times top ranked futures traders in the World Trading cup and I did it thanks to what you are about to learn. With order flow you don't just see open, high, low and close. You can literally see what the traders are doing behind the scenes, where they are buying or selling and how much. You can see trapped traders, big orders from institutional traders and HFT activity. And before you start commenting, this is not just a lagging indicator. Order flow is what moves price. A study of 2014 of over 50 stocks data proves that microstructure order flow drives short term price action with predictability, specifically order flow imbalance. So in a candle like this one, price action traders will wait for the candle to close to confirm that sellers are in control. But with order flow you can see from this level that a big seller is absorbing all the buyers and there is a big imbalance in the option. So with order flow I could start selling here while a price action trader would have to wait until here for the candle close. So in this case price is lagging compared to order flow.