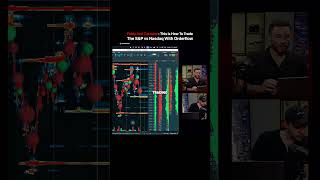
A trader explains how volume distribution shapes their strategy: balanced volume means smaller positions, skewed volume signals a trend day. They use a cage framework, drawing price ranges and watching for breakouts that immediately reverse, which signals losses ahead. The S&P 500 gets mean reversion; the NASDAQ gets trend following.
Chapters
Do you look at the shape of the volume distribution throughout the day? Like you look at how it's developing? I know that when it's balanced, I lose money because I anticipate squeeze. So I need to keep my loss small. And when I have a skew up P or a B, I have a trend directional day, so I can let it run a little bit more and I cannot. That's the reason I always draw the cage and wait for the cage to be broken like we did. But today it broke the cage, went back inside. Second time, broke the cage, went back inside. This is the day where I lose money. Have you ever tried trading S&P? I will trade S&P with a mean reverting model, not with a trend following model, because Also, when you get super trendy on NASDAQ, S&P is always giving you— Right. You know, I noticed that S&P does push, rebalance, push. NASDAQ does push, stable, push. Push, yeah. So it lets me build better. Right. It's amazing how we trade very similarly on completely different instruments.