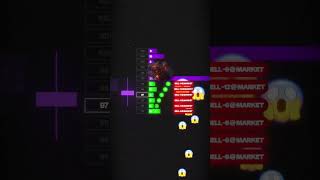
Kardec Trader explains how big banks hide massive sell orders using iceberg orders, showing only small portions while the real size stays hidden. Retail traders can spot these with tools like DeepCharts IO and use them to predict price drops before they happen.
Chapters
Here's how bank hide their big trades behind price with iceberg orders and how you can make money out of it. When price doesn't seem to be moving, you might think there's not a lot of trading going on. But behind the scenes where retail traders don't look, we see what big boys are doing. This is the order book and it's basically sell limits above the price and buy limits below the price. These are the market makers. When someone actually clicks the buy market button, for example, they're actually matched with a sell limit and this is how price move. Now imagine you're a bank and you have 2,000 shares to sell. If you just put them in the book, everyone will see them, they will panic and start selling and you're never gonna get filled.
So you will use an iceberg. For example, 10 contracts will be seen a bowl in the book, but as soon as someone buys them, they're reloaded. Someone buys 10 more and they reappear again and again. So those 10 are only a small fraction of the real order they want to sell. So just like a real iceberg, they will only show the tip of the order and hide the rest below the surface. All these buyers will get absorbed and when they realize it, they will stop buying and price will likely fall and you as a bank or a hedge fund will be Prof. And while retail traders with normal candle will not be able to understand what's going on, you can easily go on DeepCharts IO, open the chart and add iceberg indicator and get a notification as soon as an iceberg pops up. Comment iceberg to get the link in your DMs.