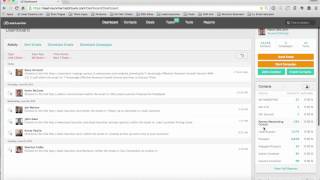
Kevin McCann walks through the Lead Launcher dashboard, showing how to track prospect activity like website visits, form submissions, and email opens. Filter by type, time frame, or team member. The pipeline report breaks deals down by sales rep and stage, and email stats show click-through rates for the past 30 days.
Chapters
Hi there, I'm Kevin McCann with the Executive Strategy Group. And in this video I'm going to show you how to use the Dashboard in your lead launcher, marketing and sales system. So you'll notice up top there's six tabs, the dashboard, contacts, deals, tasks, tools and reports. So on the dashboard when you log in, you're going to see all the current activity of how your prospects and customers are engaging with your existing marketing communications. So for instance in this case you can see here that Stacy recently in fact about an hour ago, visited our website leadlauncher.com but we can also see exactly what page she was on. The home page, the contact us page. 5 Ways to Grow your contact list here Jessica was on. So the types of activity will be denoted by the icons over here on the left hand side. We can also filter down specifically so you see only the activity that you want. For instance, if you just want to see who submitted forms recently or who has opened emails or clicked links in your emails, we can choose just those that type of activity. So for instance, if I click on link clicks, you can see that over the last seven days these people clicked links in the emails we sent out the door. It will show you exactly what day and also what time they clicked those links. So that's the activity stream. You'll also see sent scheduled and scheduled campaigns, sent emails, scheduled emails and scheduled campaigns. If you want to refer back to what happened over a certain period of time, last seven, last 30, last 90 days. So a lot of filter selections and you can also say, hey, I only want to look at emails from a certain member of my team as opposed to the entire team. So you can always filter down by person, by time frame and by the type of activity that was sent out the door. I also want to show you on the right hand side here is contact types. So these status types is how your list is segmented or broken out. So for instance, in our list here we've got 7,400 contacts have the lead status or 6,800 have the prospect status. Nice thing about this little chart over here is that it's actually a functional filter. So for instance, if you said hey, I want to go and do a marketing campaign to anyone that has the lead status, you just click Lead suspect and it'll take you over to the contacts tab and automatically filter down to those 7,400 contacts. So you can say alright, in one fell swoop I'm going to select all these people and select all 7,400 and then I'm going to start a campaign or send an email. So the choice is yours. So that's a nice feature. Second thing to look at here is full reports under the contacts area. So this View full reports will give you a quick snapshot on your deal pipeline by sales rep for all of the people. So so for instance, if you have stages in your sales process, which I'll talk you through in another video, we'll know exactly how many deals at each stage in our pipeline. So for instance, new opportunities identified, we've got six deals at that stage, four at stage two, which is the first meeting of the demo schedule, so on and so forth. So it's a nice quick view of a report which again we'll go into more detail later. So back to the dashboard here at the bottom on the right hand side you see email stats for the last 30 days and you can look at it by my contacts or all contacts in the system. And my contacts would be anyone that I am the salesperson for, effectively. So when we look at all contacts you can see very quickly unique clicks or bounces or opens over the last 30 days. Or we could just go here to the view the full reports and that'll take you to the email stats by date sent for the last 30 days. And here's the statistics of emails that you've sent out the door and then this is clickable as well so that you could go and see who are the 25 people specifically that click through on our emails. So that's your walkthrough of the dashboard and in next video we'll talk about contacts and give you a breakdown there.