In this instructional video, Kevin McCann of the Executive Strategy Group walks viewers through the Reports tab of the Lead Launcher marketing and sales platform. He demonstrates three main report categories—Email, Forms, and Sales—showing how to filter data by date ranges, view aggregate metrics (sent emails, opens, clicks, unsubscribes, complaints), and drill down to individual contacts to see detailed activity histories. For email reports, he highlights date‑sent stats, day‑by‑day activity summaries, and click‑through lists that serve as call lists for sales teams. The forms reports section explains how to track web‑form submissions, filter by sales rep, and assign leads. The sales reports portion covers pipeline views by rep, stage‑based opportunity counts, customizable pipeline lists (e.g., lost deals, upcoming closes), and user activity summaries that can inform coaching. Throughout, McCann emphasizes the granular detail and flexibility of the reporting tools, encouraging users to leverage these insights for lead prioritization, performance monitoring, and coaching.
Chapters
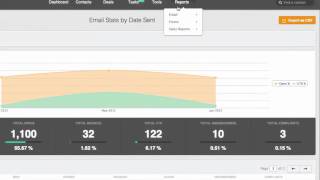
Hi there, I'm Kevin McCann with the Executive Strategy Group. And in this video I'm going to show you how to use the Reports tab in your lead launcher, marketing and sales system. So you can see I've selected the Reports tab here. And there's three different types of reports. There's email reports, which has a whole bunch of different breakdowns. There's forms reports, so the web forms and who submitted and when they submitted. Then there's sales reports, pipeline, sales activity, things of that sort. So the first default report that you're going to go to is email stats by date sent. So we can see that here. For the last, say we'll go back in time, say pick a date, we'll go April 1st to today. So you could pick a custom date if you want. You could pick just last seven days, 30 days, whatever. So for the last month plus since April 1st, we've sent about 1900 emails, almost 2000. And you've got click throughs, unsubscribes, complaints, etc. So we can see very specifically what day we send emails. And for instance, if I said there's 94 emails that went out the door on June 1, what were those emails? All I got to do is click on the day and it shows me exactly what templates I sent. And then also the response by template, which is awesome. So I can see that I sent 80 of those 41 opens. And it gives the percentages as you go through another thing that's real powerful that you think, okay, well that's great, I see those stats, Kevin, but what about who are these people? So really nice thing is that we can click on the CTR. So it says total CTR, that stands for click through rate. These 122 people clicked on the emails that we sent out the door over that period of time. So this is a perfect call list for your sales team on who specifically clicked on those emails and more importantly, what email did they click on. So we could go right into the contact level from here and then see that person and then go and drill down and see every activity that he or she took going back to the website, adding a tag, opening up an email, clicking on an email. So you've got very granular detail right from that report tab. So very, very cool. Different types of reports. So under email we looked at email stats by date sent, we could look at email activity by day summary. So we could see on a particular day over the last seven days how many were sent, how many were open, total balances. So we can see in very granular detail what activities or what actions were taken on the emails we sent out the door. Others, you know, clicks by contact, you can see. So there's a lot of different types of reports on email, but they all effectively give you the details that you want to write down to the person and what they clicked on and when they clicked on it. Forms. So form submissions. This is exactly what you would think it is. Which web forms on our site were submitted over the last seven days and how many times, and then you can break that down again by the date and also filter it by sales reps that were tagged to opportunities of people that filled out forms. So when a form is submitted, you can dictate who receives that lead and what happens with that lead once it's entered into the system. So that's forms, then there's sales reports. So we can see a deal pipeline by sales rep. And we can see this is the one that you can also access right off of the dashboard. We can see and this shows the number of opportunities by stage in the pipeline. So a stage one, deal stage two, three, etc. We can see how many deals are in each stage and it's broken down by sales rep. We can also see deal pipeline list. So this is the entire pipeline list of which we can filter any different way we want by the date that it was created by the salesperson, by the stages. I want to look at only lost deals because I want to do a loss deal analysis. Why are we losing business? What happened? Or maybe I want to look at only deals that are still active in the prospect stage and then only those that are going to close in the next month or so. So a lot of options to filter down those reports. We can also look at salesperson activities. So activity by user. What's going on with our salespeople over the last, say, 30, 30 days? We see Kevin did 37 tasks over the past 30 days, Tim did 17. The lead launcher team did one. But we can also break down and see exactly what happened. Call. The closed deal call. Connected. Call did not leave voicemail. Call left message. So we can see at a very granular level what the salespeople are doing. And it's all just pulled right off of the completed tasks by each user in the system. Very effective way to get an activity report and to make sure that if any coaching is necessary, we know exactly where to coach the user. So that's the reports tab. And if you look at other videos that we've created in this series, you can see overviews of the dashboard, the contacts, the deals, the tasks and tools, and thanks so much for watching. Have a great day.