How to View Financial Calendars on MarketBeat
Matthew Paulson walks through MarketBeat's free financial calendars and data tools, which aggregate earnings, dividends, economic releases, insider trades, IPOs, and SEC filings with filters for country, sector, and market cap. Most features require no login, though some premium displays like brokerage rankings are paid.
Chapters
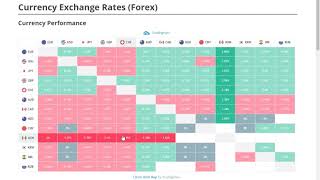
Hey everyone, Matthew Paulson here with MarketBeat. In this video, I'm going to show you how to use some of our calendars, the financial calendars we put on our website, available for free. You don't even have to log in to access these features. But we publish a variety of different calendars that you can see in our Calendars menu here and in our Analyst Recommendations calendar here. And you're going to find out with markbeats calendars, they tend to be a lot more comprehensive and there's some really nice value added data on these as well. With a lot of financial websites, they'll go to a service provider like Zack's or Quando or Intrinio or any of the places that people go to buy this financial data and they'll buy it from one place and then they'll stick it up on their website and call it a day. We don't stop there. What we do, what we figured out is that a lot of these data sets are not complete and sometimes inaccurate. So we buy all of them and then we ingest the data into our database and then we kind of filter our duplicates. We combine the data, we look for data that's obviously wrong. So if somebody set like a $10,000 price target for Apple, our system would automatically flag that and say, hey, this rating is probably not right. You should look at it before it shows up on the MarketBeat website. So when some other websites that report on analyst recommendations might report on 200 ratings a day, in reality there's actually 5 to 600 ratings changes a day that happen and we cover all of them. So here is our main ratings page. Since I'm logged in as a premium subscriber, it shows the brokerage ranking more stars the better means they're more accurate in their recommendations. And there is a whole page that you can see in Market B Daily Premium that kind of explains how these calculations work. But here you can scroll down, we've got the analyst, the action, who the company was, what the rating, and then if that changes at all, like bank of America downgraded the stock from buy to neutral. It shows that there, it'll show you the price target if that changed, and the column that is kind of unique to market. But here is the impact on share price. We have a partnership with a company called News Quantified that shows which analyst rating changes actually kind of have an impact on the share price of that stock. So certainly you want to focus on the analysts that have more of an impact on the share price than Those that don't, you can filter by the analyst ratings, strong, buy, hold, sell. You can say, I only want to see ratings for the US you can focus on Canada, the uk, Europe as well. Say I only want to see upgrades from the United Kingdom. You can do that if you wanted to. Could say, I really only care about upgrades for large cap stocks, you could do that. Or say you wanted to see ratings for a specific sector, you could do that as well. We've kind of been known for our analyst ratings over the years and we really tried to do a good job with that. So you can see by different actions, you can see by country, and you also can see ratings for specific issuers. So let's say I only want to see ratings for Goldman Sachs. I can go to analyst ratings, look up ratings by issuer, and then here are all the recent ratings changes from Goldman Sachs. I don't think anyone else has that, but if you want to look up ratings for a company, you can certainly do that as well. They're going to look up ratings, look up ratings by company, and then, then you click on a company name or you search for it. Then the analyst ratings tab has all of that information for a company, including the consensus rating, their price target, the breakdown of ratings, how the price targets changed over time, then that full detail of history for that company. We're going to move on. This is our main calendars page that kind of lists all the different calendars that we have. You can see recent buyback announcements. So when a company buys back stock, it's kind of like a dividend with forced reinvestment. Typically when a company buys back stock, there's fewer shares on the market. That raises earnings per share, and investors like that. We have a new kind of cryptocurrency section, kind of like a coin market cap or some of these other sites. But you can see information about every cryptocurrency here. And we'll dive into these probably a little bit more in another video, but we've got profile pages for cryptocurrencies as well, so you can learn about specific coins here. We do have under cryptocurrencies, there is an initial coin offerings page if you're crazy enough to invest in ICOs. We've got a list of them and then information about each one and descriptions and YouTube videos and their white paper if they've given us one. So if you want to research ICOs, you can do that on MarketBeat. Now we're going to keep moving down to dividends, so you can See dividend announcements. It's the middle of June, so kind of a slow week for dividends. But you can see a full calendar here. Again, you can filter by country, by market cap and by sector. So if you only care about dividends from the energy sector, you could do that. Might have to search a little bit to find one. Then if a company drops their dividend, you can mouse that over. You can say, oh, their dividend was $0.29, now it's $0.25. Or if it goes up, you can see that as well. You just mouse over and it will show you that. So you can see the X date. That's the date you need to own it by to get the dividend. The record date, that's when they stick it in the books. And the payable date is when you actually get the dividend. Then there are plenty of other dividend tools here. We'll probably dive into them into another video in more detail. But there is an ex dividend calendar if you want to see what stocks are going to go ex dividend. That's a pretty popular calendar. And we'll go into some more of these in another video you can see earnings announcements. So these are all the companies that have announced their earnings today. Same kind of filters, country, market cap and sector. And then you can certainly go back in time. And then let's say you need to find a company's earnings date. Your when is Apple's earnings date again? I just don't remember. There's a little search button here. You can click on that and it'll send you to the company profile page. Click the earnings tab and then it's kind of hidden a little bit. But right there at the top of that earnings calendar, you can see the next earnings date. So we look to earnings. If you want to see who's going to announce earnings tomorrow, you can certainly do that as well. It'll show if it's going to be released before the market opens, after it closes, and what the analysts are expecting. So you can always see what's coming up. You can see economic reports. So when's unemployment going to come out? Who knows what foreign trade balances. You can see when all these numbers are going to come out as well as what the estimates are for them. And then you can see the ones that have recently come out as well. If you're into currencies at all, trading currencies, we we've just added a recent map that will show you how different currencies are performing relative to each other today. So the day I'm doing this looks like the Mexican peso is not doing so hot compared to some other coins, if I'm moving that correctly. And then you can see the different exchange rates for different currencies. And this is thanks to a partnership from TradingView that we have this. If you want to look up insider trades so insider buying and selling, you can do that. You might only want to see the bigger transactions. So you could say, show me transactions over $100,000. You can do that. Again, filter by country, by sector and by market cap. I think we really only have insider trades for the US and Canada. And then you can filter by date and you can go back in time, I think about six months before we can cut it off. We also have a list of the stocks with the most insider buying and insider selling. So here we can see like Opcohealth has had 33 insider purchases in the last 90 days from 4 different insiders. That could be a buy signal. Here we see Columbia Financial. Seven different insiders have purchased shares in the last 90 days. That's kind of interesting. When a lot of different people are buying their company stock, that could be a good sign. Then conversely, we have top insider selling stock. So if a lot of different insiders are getting out, like say GoDaddy here or Salesforce or At Home Group, they have all had more than 10 different insiders in a company sell shares in the last 90 days. You probably want to dive into this a little bit more to kind of look at this because oftentimes insider selling is just executives, executives going through or selling their options. So here, like in this transaction for At Home Group, it looks like this person was awarded 6,300 and change shares and then they just sold them right away. So that's probably not indicative of that person's belief. So you do kind of have to dig through these a little bit just to make sure that these are true insider selling and not not just people exercising their options. But that could be lots of different insider selling stock. That could be a nice short signal if you do short trades. Got a list of upcoming IPOs. If you like to trade IPOs, you've got that list lockup expiration. So if you own shares of an IPO before it goes public, you can't sell your shares right away. So a lockup expiration kind of tells you when insiders and CEOs and whoever can sell their shares of the stock. So typically when the lockup expires, the share price will go down a little bit for a while as these people kind of unload their shares. So if you want to see that, maybe that's an opportunity for a short. Then if there's news, the company can have a quiet period where people can't talk about it or they can't release news. And you want to see when those expire. You can do that. And there's a big section down here called market data and right now it's kind of a, kind of a hot mess. But there's a lot of different reports here. We want to see companies that have hit a new 52 week high. You can see that and we have a lot of these kind of financial based calendars. But what's different about here is we try to have reasons why. So Apple is at the top of the list today. They just had a lot of news reporting on their worldwide developer conference. So we see a lot of news stories have come up from Apple in the last day or so. There's been insider trading recently, they've been subject to an analyst report recently. Then you can click through and kind of see those details. So for all of these different reports that we have for say a gap up stock or gap down stocks, which are stocks that have gone up or down overnight before and after trading, we show all these different indicators. There are plenty of other reports here. If you want to see stocks low PE ratios, you can do that. These are stocks that are largely kind of out of favor in the market once the page loads. So if a company has a low PE ratio, that just means it's trading at a very low price to earnings and probably filtered to large cap companies recording this right as the market closes. So there's a lot happening on a MarketBee website right now. Let's say ICANN Enterprises is trading at a PE ratio of 4. You might think that's a steal and that might be a reason to buy in. You can see which stocks are most active today, had the most trading volume. You can say that you can do it by dollar volume or by share volume. You can see the biggest winners and losers for the day. Open some of these in new tabs so we can get to them more quickly. But here are kind of the biggest gainers for the day as well as kind of the reasons why, what the price was, what the price change was, everything that's going on with the stock. One of my favorite things on our website nowadays is the sector performance map. So it's kind of a really neat visual interface. It takes up the full screen. You can see, oh, technology Stocks did really well today. Well, most of them did. Google was down a little bit, but Apple, Microsoft were up. You can see retailers, how they're doing. Amazon was up, Walmart was down. Different medical companies, business services companies. Visa and MasterCard had a good day, but consumer staples companies had a bad day. Over here, banks largely had a bad day. You can see that basic materials did well. It's kind of a really neat visual way to see the entire market. And then there's details at the bottom here. You can even zoom in, say I want to see what's really going on with the banks today. You can zoom in and then it will show you all the different companies here. Morgan Stanley was down a percent and a half and you can zoom in really as far as you want. And then you can kind of click through to that company's page if you want to. It's a really neat tool. We put a lot of time and money into it. So I hope you guys will use it and make some good use out of it. You can see which companies have the largest short interest positions here. That's also under market data. I can do that. You can see changes in short interest. If you want to see companies that had big interests have had a lot of short interest go up in the last, since the last report, you can do that. My short interest comes out twice a month, I think, like on the 1st and the 16th. So those updates has been updated since May 15th, but hopefully they'll get updated soon. If you want to see if there's been, you know, unusual put and call activity, we got some of those numbers. There's, for whatever reason, a lot of people buy in put options or call options will report on that. You can see volume movers. These are stocks that have had a lot more trading volume than they usually do. That's there. If you want to know when the stock market is closed, I've got a calendar for that. We also have, I think for all the countries we cover, U.S. canada, UK, Australia, we've got an SEC filings page here. You can filter it by form type. So say you only want to see 10k reports, you can do that. Or if you only wanted to see for a specific company, you could type in their ticker symbol or their CIK number and then say, I want to find Wells Fargo. Well, Smarter's 10K report. There it is. And click through right to the SEC website and get access to that directly from the sec. We just try to make some tools that will just make it a little bit easier to use. And we've got a calendar for upcoming stock splits, which typically, if a company's going to split their stock, that's good news for them, and you can see when those are going to happen. So our kind of fundamental belief of this, all these calendars that we make available for free, no longer, no login required, anything like that. It's just that you as an investor should be able to get the same kind of information that you might get with like a Bloomberg terminal, but we don't think you should have to pay for it. So we have a ton of these different reports and they're all available for free, and hopefully you guys can make some good use of them.