Matthew Paulson demos RatingsDB, a tool with nearly 200,000 stock ratings from 420 brokerages. Search by ticker to see analyst ratings, price targets, brokerage performance rankings, earnings history versus estimates, and company profiles all in one place.
Chapters
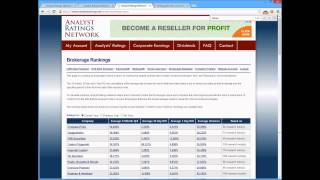
Hi, this is Matthew Paulfsen with Analyst Ratings Network. I wanted to take a moment to introduce you to ratingsdb, our advanced stock research tool that provides exclusive access to Analyst Ratings Network's database of hundreds of thousands of stock ratings. You can use ratingsdb to perform advanced searches by analyst company, industry and sector, action date, current price, price target, keyword, just about anything that you can think of. And you can sort the results by any way that interests you. The columns here are fully customizable and you can save your searches for later when you want to run them in the future. So I wanted to take a moment to show you what it's like to research a stock with Ratings db. We're going to use the Gap for our example. So I've typed in GPS into the stock ticker and click the Perform Search button. So as you can see, we found about 200 ratings in the last couple of years for the Gap. We see a table of all the recent changes for the Gap. So we see that today Stern Aggie reiterated their rating on the Gap, an underperform rating, and they set a $40 price target. So let's see what details we have available for that rating. So I clicked the View button and the Ratings detail page loaded. We see much of the same information as well as some additional information that's helpful. So we can see, we mouse over Stern Aggie, we can see their rating system. We see the underperform is Stern Eggy's lowest rating. Their price Target represents about 10% downside from the price of the stock on the report date. We also have an excerpt from the research note. So this is kind of from the summary paragraph of the actual research note that Stern Aggie sent out. We have links to a couple of mentions for this rating change on investing websites. We have some information about the GAAP, kind of a company description and we have more ratings from the GAAP and more ratings from Stern Aggy. So let's say I'm not terribly familiar with Stern Aggie and I want to see whether or not they're a brokerage that's worth listening to. So let's move on over to our brokerage rankings page. And what this page does is provides an average ROI for a 12 month, 30 day and 7 day period for each brokerage. So for example, if you held onto Miller Tabex stocks and you bought all of the recommendations, held them for 12 months and sold them, what ROI would you get over a long period of time? It would be about 20%. And we see the same numbers for 30 day and 7 day. Those aren't annualized and we see how accurate their price targets are. Lower variance is better. That means they get their price targets right more often than not. So let's scroll down and see how well Stern Aggie has done. We see for 12 months they've done about 10.7% and their variance is about 36%. So they're middle of the line. Good. Not great. But you can use this page to just see which brokerages have done well lately, say last year, all time. If you're a long term trader, you might want to look at their 12 month recommendations. If you're more of a a day trader you might look at their seven day recommendations. You see can of Cord genuities recommendations tend to have a nice seven day bump. So that might be worth looking at. And you can see which brokerages get their price targets right more often than not as well. So let's continue along. This is the Earnings DB page. You can use this to look up earnings history for companies, sectors, industries, just about anything you want. And you can say find only companies that have earnings or missed their earnings by 10, 20, 30%. That's kind of a neat feature. But right now I'm just looking up the earnings history for the gaap. So we see here their most recent earnings announcement. They beat their earnings by say about 2 cents and they had a slight beat on revenue as well. So let's look at the details page for the GAAP here, the earnings announcement. We've got all the key numbers there. We've got the EPS info, we've got the year over year, how their revenue wise versus the estimate and the over year revenue growth. Links to the conference call if you want to listen to it. So you can hear the CEO and CFO talk about their earnings. And you've got a link to the actual earnings release as well if you want to take a look at that. Let's move on to the company profile section. So this is a list of companies that have received the most coverage from analysts. And this is a list of companies that have received the highest average ratings from analysts. So those stocks might be worth checking out. But let's go back and research our company. That is the gap. So let's look at their company profile page. You see their logo, you can see what industry and sector they're in, some details about the company, kind of a description, our recent headlines for the company from today, some recent ratings, earnings history as well as some key technical info if you're interested in that as well as links to the Gap on Google Finance, Yahoo Finance, and Reuters. So that's kind of what the company profile pages look like. So that's the basic functionality of ratingsdb. I believe we have the most comprehensive database of stock ratings that exist on the web. As of the date of this recording, There are nearly 200,000 stock ratings from 420 different brokerages in our database. We believe that RatingsDB can provide you the insights from analysts that you need to be a successful trader, and we hope that you'll find it valuable. Thanks.