Webinar Recording: How to Use MarketBeat to Research Stocks and Monitor Your Portfolio
Recorded MarketBeat product webinar (presenter: Matthew Paulson) demonstrating how to research stocks and monitor portfolios using MarketBeat. Opens with an attendee poll (My MarketBeat and analyst ratings most-used), explains MarketBeat's mission and product philosophy (affordable, easy, relevant, educational, responsive), reviews recent and upcoming features (insider trading reports, ETF research charts, sector performance map, upgraded/downgraded reports, top-rated analysts), and includes live demos of analyst pages, calendars, portfolio settings and Q&A (support email, response time, subscription limits).
Questions this video answers
36% My MarketBeat; 33% analyst ratings; 16% daily newsletters; 10% instant alerts; 6% other.
5.
Unlimited.
Typically 24 hours.
Chapters
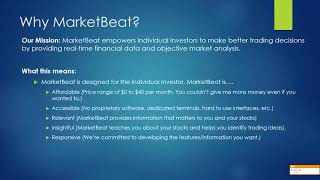
Well, you guys, I've had you muted for the last five minutes. I started talking and I was muted. So none of you guys could hear anything that I said. We're doing a poll right now. Hopefully you can hear me. And the question is, what is the most popular feature or feature that you use the Most on the MarketBeat website or in general? A lot of you are saying my MarketBeat. A lot of you are saying analyst ratings. No surprise in either of those. We had a buy market beat like a year and a half ago and that's become a very popular feature and not really long over time. And then we've always kind of had the best coverage of analyst ratings and I'll tell you why a little bit. So not surprising to see that that's a popular answer too. So thank you to those of you that are doing the poll. And we are officially going to get started in a minute. So I'll give you guys another minute to do the poll and then we will get going. Okay, it is three o' clock in my calendar. The poll results. What is your favorite MarketBeat tool? 36% said my market beat. 33% said analyst ratings. 16% said the daily newsletters. 10% said instant alerts. And 6% said something else. So thank you to those of you that did the poll. It's three o'. Clock. We've got about 140 people on. Honestly, I'd expect another hundred people to show up in the next few minutes because people typically don't show up on time, but hopefully they'll catch the recording. We had a thousand people register for this and typically like 30% of people show up for a webinar. So I see the number ticking up and we'll just get going. Everyone else can join us as they kind of as we kind of move through. Before we do anything else, do need to read a disclaimer to you guys. I think you probably see this in a lot of financial webinars, but nothing in this presentation shall constitute a recommendation to buy or sell any security. Trading stocks and options involves risk and specific financial issues should be addressed with your financial advisor. Past performance is no guarantee of future results. Markabee and its principals, that's me, Matthew Paulson. We are not registered financial advisors and I definitely don't want to be one when I grow up. Not a job I aspire to be. So now that my lawyer is happy, we'll kind of go through the agenda for today. The title is using Market B to research stocks and monitor your portfolio. So I'm going to show you on the MarketBeat website kind of how to do a whole bunch of different things before we get into deep. Could you just type in the chat, maybe in the questions area, if you guys can hear me and see the screen and make sure that everything is working like it's supposed to. So you just say hi from wherever and I'll say hi back to you. And then that way we will know that everybody can see the screen and that way everyone can hear the audio. Lots of people saying hi. Miranda from Tulsa, Oklahoma, welcome. Steven says hi from wherever. Michael Scott says hi. Wonder if that's actually Michael Scott or Michael Scott from the office. Got Mark, Ronald Dean, lots of people saying hi. Got up to 194 people on the webinar. So glad to hear that you're all able to see the screen and get going. We'll get going. So what we're going to do today on the agenda, we're going to talk a little bit about some of the philosophies behind MarketBeat. This will only take a few minutes. But we didn't do this on last week's webinar. I really want you guys to understand why we do some of the things the way we do them and how that can be beneficial for all of our subscribers, which is all of you. We're going to cover a couple of updates on new MarketBeat features that we're working on. We've even launched some stuff since last Tuesday's webinar. So I'll show you some of the new features that we've launched. And yes, I did press the recording button, Renee, So hopefully the recording will be will be good to go. I talk about some new features that we've launched. I'll show you those and some more stuff we're working on. I'm going to walk you through my market beat, how to do portfolio monitoring, how to set up alerts, make sure all that stuff's working. Okay. I'm going to go through some of the financial calendars on MarketBeat. Those are always quite popular. Walk through some of those and how to get some stock ideas through those. Gonna walk through company profile pages, some good stuff on those pages as well, especially the charts. I don't think most people know how to use all the features on the chart. So I'm gonna spend some time on that and I'll show you a few things with markbeatowaccess. I've got a deal if you want it, and we'll do some Q and A at the End as we go through features, feel free to type in questions. Last week when we did this, people just typed in questions as we went and I tried to answer them and I think we'll do the same thing this week. So MarketBeat's mission, we seek to empower individual investors, that's you guys, to make better trading decisions by providing real time financial data and objective market analysis. So we're here as a company to help you guys to get you the information and the market data calendars, whatever news headlines that you need to research, trade, you know, stock trades and positions and all that good stuff. So you know, what, what does this mean for you guys? We have tried to build a marketing as a service that is one affordable. The price range is free to 40 bucks a month. You can give me more money if you wanted to. Agora Financial, they're the big player in our space. They'll charge $2,000, $3,000 a year for their products and our most expensive one is $500. So we really try to make this affordable for you, try to make it easy to use, we try to make it accessible so we don't have like a proprietary software download. You don't have to buy like a dedicated Bloomberg terminal. We try to make the site easy to use, we try to make it relevant. So, you know, we try to give you the information that matters to you and the companies in your stock portfolio. We try to make it insightful. We want to teach you stuff about your stocks that you don't own or that you don't know. And we want to help you identify trading ideas. And finally, we want market to be responsive, which means we want to build tools and reports and data and everything that will help you guys do your stock research better. So those are kind of the core tenets of how we run this business. We want market to be cheap, we want it to be easy to use, we want it to give you relevant information. We wanted to educate you and we wanted to just really be helpful to you and how you guys do stuff. We also, we do offer comprehensive financial data and market data. Got a lot of calendars on our website. If you compare like our analyst recommendations calendar to everybody else's, like the one on briefing.com or the one on Tip ranks, you're going to see that ours has, is just a lot more comprehensive than some of those. And the reason is we rely on about 30 different data sources to make that calendar. And then we do some automated combining of the data. We check for errors, we merge duplicates, we Know that if Somebody sets a $5,000 price target on Apple, nobody's going to set that price target. So we know it's an error and then we flag it and we check it. So we have some really good automated error checking on our calendars to weed out bad data. And we just have better data sources than some of our competitors. So you might not notice that initially, but if you were to compare, you would find that we'd have some. Our calendars tend to be more comprehensive. You know, we are also aim to have really a complete set of research tools for you guys. We want news for your stocks, reports, company data. You know, we want to be your primary stock research site. And then finally we don't editorialize the data. You know, I'm not the motley fool. I'm not a stock guru that pitches stock picks. I don't cryptically tell you here's five stocks by now, give me $2,000 and I'll tell you what the stock is. We don't do that. And all we are trying to do is provide objective information so that you guys can make better trades. Next thing we're going to do is talk about some new features that we've recently launched and some new stuff that we've got upcoming. A couple weeks ago we added an insider buying and selling reports. You can see the stocks that have had the most insider buying and selling. So sorry about that. Here you can see we've got some questions. We'll get back to those in a second. We have, we can see for the last 90 days we've had Ecolab have six insider purchases and then two different people buy it. Let's look back like six months, a couple really interesting things like we've had eight different people buy shares of CenturyLink. Eight different people buy insiders buy shares of Wild Open West. So if you are operating under the assumption that corporate insiders know something about the stocks they are shareholders of and you think them buying that is a good thing or excuse me, is an indication that the stock is going to go up. You can use that to identify this and then find some trading ideas. We've also got, you know, a list of stocks where you know a lot of insider summary this happened. GoDaddy has had 14 different insiders sell shares in the last 90 days. So obviously that might be indicative that their executives aren't super optimistic about the near term. The near term, the near term prospects for the company. Some questions that we're getting already. Mark Holman says what email do you use to Report errors or publishing or missing symbols. Contactbeat.com how might one use MarketBeat to identify momentum stocks or ETFs or sectors breaking out? Hopefully we'll get to that as we go through. What response time do you provide your emails? Typically 24 hours. Is this real time data? Yes. As soon as we get data in our database, it's on the website. I can't hear you. I have no audio. Not sure what to say about that. There will be a recording if you're having problems and we'll hopefully try to, you know, we'll get a recording on YouTube to fix that. Some other new features, we have some ETF research tools. We have an ETF screener for compute all access subscribers. And then you can see here. We're gonna have to hold off on questions for now. I'm just getting too many. We're gonna, we'll get to them with Q and A at the end. But for ETFs, you can see we've got a bunch of charts so that you can see the geographic exposure, what countries the ETF is exposed to, what sectors it is exposed to, what industries and ETF is exposed to currencies as well. We've added that. So if you're looking at ETFs, we've got some more information now. Our sector performance map. Rebecca And I, Rebecca McKeever is on with me. She works for Markabee. We were working on the sector performance map today. It's a really neat thing. I like to show off as much as we can. But it will show you kind of in a map which how different sectors are performing in the market at any given time. So we can see that today that a lot of financial industry, a lot of banks didn't do well today. We see Amazon did super well today. You can kind of see the whole S and P500 at the same time. Let's see. Got a couple people saying they have audio and no slides. That's a good question. I don't know how to do Gotowebinar that well. Click around in the buttons. Hopefully it'll come up. If you're having problems and I can't help you, Glenn says tell people to log off and log back on. So if you're having audio problems or screen problems, try logging off, try logging back on. Sector map is here. Works pretty well. We're going to try to make it a little bit more readable, put some more space in between sectors. But it's kind of a neat thing to check. And then when we do our new homepage. That's going to be right on the homepage as well. We just added a most upgraded and downgraded socks report. This is available to our all active subscribers. So if you want to see here, Netflix was upgraded 28 times or I think had their price target increased in the last 90 days. Splunk don't really know what they do. They've upgraded 29 times in the last 90 days. And then we also have a most downgraded stocks page that we just added then say, you know, L brands, if they used to be limited brands, you know, they were downgraded or had their price target cut 17 times in the last 90 days. So that might be kind of a way to get some long and short positions, you know, I guess for your trading ideas. One other thing I wanted to show you, we do now have a top rated analyst page available to all Access subscribers. So if you are. So if you are familiar with tip ranks, very similar to that. Using our data, I think we have better data than they do. We don't have it made it the core tenant of our website like they have, but we do if this page wants to load, you know, we'll show you the article ROI of individual analyst recommendations. We've always had broker recommendations, but now we're gonna break that down to individual analysts. So you can say, okay, this analyst, their recommendations have done really well over a long period of time. Maybe I should take a look at their recommendations. That page is being kind of slow, so maybe we'll get back to that later. Some upcoming features. Rebecca and I are working on a new homepage. So we're going to make kind of a homepage that is more useful to people that are familiar with MarketBeat. So we're going to have news on our homepage, a sector map, some different little calendars that will expand. We are working on headlines making them more relevant. There are some companies that have very generic names. I can't think of a good example, but say if you typed in General Electric and General Electric was more than just the name of the company, false positives would show up. So we're working on kind of fixing some of that stuff. We are going to make it easier to manage stocks and by MarketBeat and we are going to hopefully add some more features that you guys tell us to add. So MarketBeat is really a tool that we have built for you guys. We want to make it as easy as possible for you guys to use. Back to the agenda. So now we're going to head on over to the Market View website. Hey, there's the analyst rankings. So we can see a guy named Thomas Schrader from Stifo Nicalis. I probably butchered that name. His recommendations have resulted in an average 12 month ROI of 157%. 30 day ROI of 7.5%. 7 day ROI of 12%. So basically, if you hold this guy's recommendations for a year, historically, who knows if that will keep up, but he's returned 157% on his recommendations historically. Oh man, lots of questions today. So D.C. nunes says, how many stocks can I have in my portfolio? If you're a free subscriber, you can have five. If you're paying us any amount of money, it's unlimited. And then he also asks, what about international data? In a lot of our calendars we have country drop downs. You can say, I only want to see the us, UK or Canadian ratings. You can filter that by country on a lot of reports. Okay. And then Cirium says, can you add a column here about these analysts buy and sell recommendations? Yeah. So if you go back to the top rated analyst page that we were at, if you click on their name on that report, it will show you their most recent recommendations.