What If You Only Invested at All Time Lows (Based on Research)
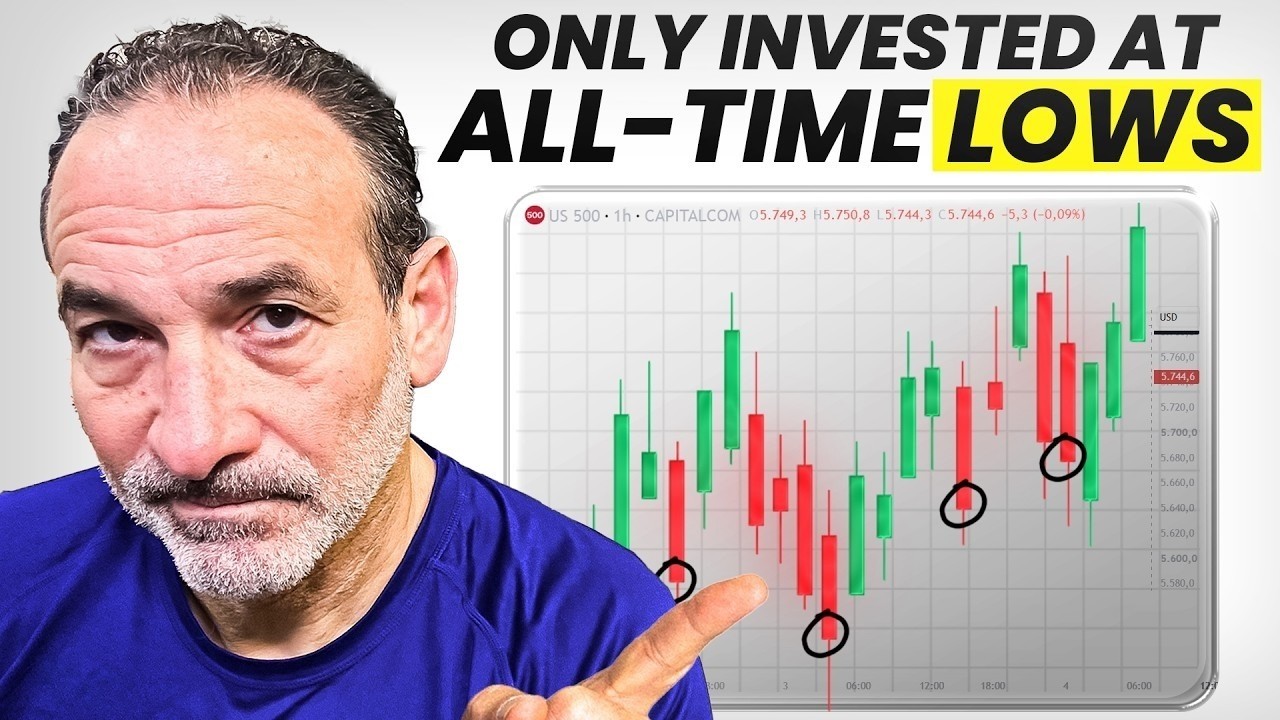
Mel Abraham breaks down why timing the market at all-time lows fails: Schwab's research shows perfect timing beats annual investing by only $15,500, while missing the ten best market days cuts returns roughly in half. Consistent dollar-cost averaging outperforms both, and Abraham shares how cashing out during a market scare cost him over $3 million.
Chapters
You've been waiting for the right time to invest. You know, maybe it's been months or maybe even longer. And the market runs up and you think, "Ah, man, did I miss it?" And then it drops and you wonder, "Well, is it done falling?" And you keep watching and waiting for that moment when the timing's finally right, when you can get in at the lowest possible price and know you made a smart move. See, the research has actually already tested this question and what it found changes the math on every reason you've been waiting for. So in this episode of Building Your Money Machine, we'll walk you through what the data shows about trying to buy at the low and what it does to your returns and why professionals can't actually pull it off either. And what a consistent investor who started on the worst possible day in American market history still managed to build. This is Building Your Money Machine where we help you master your money, eliminate financial stress so you can live a life by choice. And I'm your host, Mel Abraham. And after 30+ years, I have seen this happen over and over again. But by the end of this, you'll know exactly why waiting for the perfect low has been the most expensive decision you never knew you were making. Let's do this. I want to take you back to gym class in grade school. Think about this. The jump rope game that we used to play. You had two kids, they had the rope on each end, and you're standing in the middle on the side. Watching the rope go round and round and round, trying to figure out the exact right moment to jump in and jump the rope. And you just stand there watching the rope. The markets go up, I'll wait for it to come down. And then the markets come down and I don't wanna catch a falling knife, so I'll wait for it to stabilize. It stabilizes, but the news still feels uncertain. And there's always a reason to just keep watching the rope spin. While you're standing on the side and the game is happening without you. Now, here's the question this whole episode is built around. What if you could time it perfectly? What if every single year you invested at the absolute lowest point of the market and the exact bottom every time for 20 straight years? Well, I have an answer for you. Schwab did this study because this is what we're trying to, to hit on, is that can we time the market? What's the best way to maximize and optimize your investing to build your wealth in the fastest way possible. Well, Schwab Center for Financial Research ran this exact experiment in a study called "Does Market Timing Work?" And they gave us 5 hypothetical investors. Each of them had $2,000 a year for 20 years. Same amount, same market, very different approaches. All right. Now, here's the thing. Now, Schwab named these people, these investors. So let's have fun with them. The first one was Peter Perfect. I didn't make up the name. Peter bought the absolute lowest market close every single year and the lowest closing price every single year, perfectly timed. Then the second investor was called Ashley Action. She didn't try to time anything. She simply invested her $2,000 on the first trading day every single year. And then you have Matthew Monthly. He took his $2,000 and he cut it into 12 equal monthly contributions. So he used a dollar-cost averaging process for his $2,000 throughout the year to invest. And then there's Rosie Rotten. She had the worst luck of all. That was her actual name in the study. So she couldn't have timed it worse. She bought at the peak, at the high, every single year. And then the last investor was Larry. Larry Linger, they called him. Larry, he never invested in any stocks at all. He kept everything in cash in a savings account, convinced that he would find a better entry point just around the corner. Well, they took that out 20 years, and here's what each of them walked away with. Peter, he timed it perfectly, every low, and he ended up with $186,077. Ashley, who invested on day one every single year, she ended up with $170,555.. Then Matthew, who invested monthly using dollar cost averaging every single month, he ended up with $166,591. Then Rosie, the one with the bad luck who bought at every high point, every peak, she ended up with $151,343. Well, and then there's Larry. Larry Linger. He was waiting for his cash to have the perfect moment to jump in. And he never did. So he ended up with $47,357. Look at the gap between Peter and Ashley. 20 years of buying at the absolute low point every single year only produced $15,500 more than just showing up on the first trading day of the year with zero market analysis, zero stress, zero trying to figure it out. That's $15,522. That's the total prize for perfect timing over 2 decades. And all it requires to get that prize is being right every single year, never missing once. No crystal ball, zero margin for error. Totally doable, right? I don't think so. Now let's look at Larry. He didn't make any bad investments. Well, he didn't make any investments. He didn't buy at the wrong time. He just kept watching the rope spin and the markets go up and down. He ended up with $47,000. Peter walked away with $186,000. That is an almost $139,000 gap between the two of them. And it came down to one thing, whether you were in the game or not. So one more thing before we start to move on. If you look at Ashley and Matthew, Ashley who invested at the first day of the year and Matthew who, who invested using dollar cost averaging, then that was only a $4,000 difference after 20 years. See, investing immediately versus dollar cost averaging cost averaging financially, they're nearly identical. Now, the reason that most people will choose dollar cost averaging— I do dollar cost averaging, and so do a lot of my clients and, and students— isn't because the math is dramatically better. It's because it's putting in a fixed amount every single month, and that removes the emotional gut punch of going all in right before the market drops. Effectively the same financial result, dramatically though better behavioral experience. See, but Peter's results requires one thing, getting the exact low every single year without fail. So the question that we have to ask ourselves, which is the title of this, is whether anyone can actually pull that off. Well, let me give you 3 data points and then I'll show you the path that works. And the first data point is this, what real investors earn when they try to time the market is not what you think. There's a study about Dalbar. Dalbar tracks the gap between the market returns and what average investors actually take. In other words, what does the market do and how do average investors respond? And so they did an investor behavior study. And in 2024, the S&P 500 returned a little over 25%, 25.02%. But the average equity investor earned 16.5%, 16.54%. %. That is almost 8.5 percentage point gap in a single year. Not because they own bad funds, but because of the timing, the decisions they made of going in and out. That's it. That's the only reason. 8.5% compounded year after year. That's not a rounding area. That is the difference in two different, completely different retirement scenarios. So we see that An individual investor doesn't do it well. But what about professionals? Because I mean, obviously professionals, they got the big algorithms, the big computers, the smart people, they got to do better, right? Well, there's another study that was done, and the S&P 500, the index tracks fund managers across the entire industry. And over a 10-year period, when you start to look long-term, 85 to 90% of actively managed Funds, US large-cap funds underperformed the S&P 500 based on the SPIVA US scorecard. 85 to 90% cannot beat it. That's the people with the research teams, with the proprietary data, the algorithms, the big computers, the Wharton grads. Most of them can't beat an index fund over a decade. Peter perfect, it turns out, is very hard to find on Wall Street. Now, there's a third data point I wanna give you, 'cause this one is the one that should keep you in the market when things get scary. JP Morgan did a study and they found that missing just 10 days out of a 20-year period, 10 of the best trading days, in other words, 10 of the biggest ups, up days in the market over 20 years, cut the returns on the portfolio by roughly 50% versus just staying invested. In other words, just buy and stay in the game. But if we try to time it and we happen to miss the 10 best days, we cut our returns in half. Now here's the crazy thing. 7 of those best 10 days happened during bear markets. In other words, down markets. Think about that. The days that would build your wealth the biggest happened when fear was the loudest, when the headlines were the worst, when every instinct says get out and wait. Sitting out the scary days means sitting out the days that build most of your wealth. Because you just don't get one without the other. The path forward is a system that keeps you in the market when every instinct says otherwise. The most powerful proof of that system comes from a time in our history is the worst stretch of market conditions in American history. Think about this. What if you got in the market and the market literally went nowhere for the next 25 years? It just went sideways. It didn't do anything. What would you do? What would happen to you in, in that process? And so the Schwab data that we just talked about, it settled the timing question. Perfect low buying barely beats just showing up, and nobody can execute it reliably anyways. But there's a second fear underneath all of this, and it sounds like this: what if I stop waiting, I go ahead and I commit, I start investing consistently, and then the market just stalls? What if it goes nowhere for the next decade or two decades? What does consistent participation look like when the market flatlines? Now, that fear deserves a direct answer, and it comes from the worst-case scenario in American history. And full credit has to go to my, my good friends Brian Preston, Bo Hanson at The Money Guy Show for this research with the underlying data coming from Fidelity. Here's what they found. They looked at it and said, let's assume the market on September 3rd, 1929, the Dow Jones closed at $381. 25 years later, in November of 1954, the Dow closed at $383. $2, $2 in 25 years. That's crazy. If you bought the Dow on September 3rd, 1929, and held it through November of 1954, you made a sum total of $2. Bought at the peak right before the Great Depression, held through everything that followed, and came out 25 years later, essentially nothing to show for it. That's it. That's what would happen if the market went nowhere actually looks like in real life. But here's how this changes. And this is what a consistent investor can get during the exact same time period. Now, this is important for you to understand because this is why I think we need to be in the game, playing the game regularly. Imagine this, during that same timeframe, you are investing $10,000 every single year, starting September 4th, 1929. And you reinvest the dividends every single year. There's no timing. No waiting, you just show up every single year through the Great Depression, through World War II, through all of it, totally invested. And on November 1st, 1954, you would have put $260,000 into the market, but you would have $1.5 million during the same time period that the market went from $381 to $383. The same 25-year period gave you an 11.7% per year return. How? Because in the down years, and there were many, that $10,000 bought more shares at lower prices. Dollar cost averaging. Those shares compounded, dividends reinvested, and you bought even more shares at the same low prices. And when the market eventually recovered, Every share bought during the dark years was now worth significantly more. The lump sum investor result depended entirely on the distance between the starting price and the ending price, $2. But the consistent investor, that result didn't need the market really to go anywhere. The process kept buying, the process kept compounding, and the process kept accumulating through the worst conditions the American market has ever seen. The same market, the same 25 years. One investor made $2, the other made $1.5. The difference was a process that turned a flat market into a wealth-building machine. So why do people still bail? If the data goes back 100 years and, and the answer never changes, why does fear still win in the moment? Well, let me show you what that looks like and when it does and what it cost me personally, because I did this. I went to a show that was a speaker at, and this speaker was talking about doom and gloom. And what he talked about was the emotions. Now, my emotions kicked in in a big way because when the market rose, I was excited. It climbed higher, I got overconfident, and that took over. But then all of a sudden it would tip over. I would have anxiety and it would creep in at the top, and then fear would come in and I would panic and I would get out. That was the rollercoaster ride I was on. Before I understood what I know now. And then the impatience would take over during the flat period before it recovered in every single cycle. By the time any of those emotions came in and I thought it was safe to act, I was always one step behind, one beat behind. I got excited too late to catch the early gains. I panicked at the bottom, right when I should have been holding. And I waited till the things felt safe before I would buy back in. But then it got so much that at one point I simply just got out. I got out. It was a long time ago. It was about 34 years ago. I literally sat in a conference and listened to a speaker make the case that the market was going to collapse. Fear-based, doom and gloom, get yourself to safety before it's too late. And I felt it. And I didn't even wait for him to finish speaking. I literally got up, went out to the lobby, called my broker and said, put me in cash, put me in cash, I don't want to play this game anymore. And so he did. I cashed everything out, but there I stayed for a decade. I thought I was being smart, playing it safe, waiting for the right move to get back in, for that rope to spin around where I had an entry. Here's what actually happened. I stopped investing entirely. I made no more contributions, nothing going in. My money was sitting in cash that I had. No participation in the market of any kind. I didn't just miss 10 years of market growth by sitting out. I missed 10 years of contributions going in because I stopped investing for a decade, but I missed all 34 years of compounding of everything I had because I was sitting on the sidelines. Every dollar I should have invested in 1991 didn't miss one year of growth. It missed 34 years of growth. The dollar I should have put in in '92, the same story in '93, '94, every year for a decade, dollar after dollar, zero compounding. I got hit from both sides at once. No new money going in, no existing money growing. The cost of that one phone call that I made, 90 seconds from the lobby of a conference, driven entirely by fear, amounted to a total— when I did the calculation, of over $3 million in missed investing and missed investment growth. Y'all, I'm a CPA and I had more than 30 years of financial knowledge when this happened. I understood markets, but not the way I do today. And I still made that call because when emotions go up, your financial intellect goes down every single time. And the antidote to that isn't more willpower. The antidote is a system that removes the decision from your hands before fear even shows up. Dollar cost averaging, meaning consistent automatic scheduled contributions, is exactly that system. You invest on a schedule regardless of what the market's doing. When prices are low, your fixed amount buys more shares. When prices are high, it buys fewer. The average cost comes out over time. The compounding stacks up and your emotions never get a vote. Afraid or not, the system keeps working either way. So let me bring this home. The Schwab study gave us Peter Perfect, 20 years of flawless low buying every single year. He outperformed the investor who just showed up by $15,522. And Larry Linger, who kept his money in cash waiting for the perfect moment, he finished with $47,357. Then the 1929 proof showed us that consistent participation Engagement in the market, what it does when the market literally goes nowhere. The same 25 years, one investor made $2, the other investor made $1.5 million. See, the money machine runs on a consistent participation, not perfect timing. Get in, stay in, keep adding. The gap between investing immediately and dollar cost averaging is less than $4,000 over 20 years. The gap between both of those and sitting on the sidelines is your entire financial future. I get it, the fear is real, the uncertainty is real, but the fear is a terrible portfolio manager. It has never once been right about when to get out. I hope this helps. I hope this gives you perspective. I hope it gets you in the game. And if this episode shifted something for you, let me know. Reach out. If you have questions, reach out. I love having conversations with y'all. Drop me a comment, drop me a DM, gimme a thumbs up and share it with someone in your life who's been watching the rope spin and wondering when to get in so they know what they need to do next. All right. And if you haven't done so already, hit that subscribe button so you're here for the next one, 'cause I got so much coming your way because earning more doesn't make you free. A money machine does. And I wanna help you build it. All right. Till I see you in the next one or on your path to financial freedom, as I always say, always, always strive to live a life that outlives you. See you in the next one. Cheers for now.