2020 - Topological Data Analysis for Arrhythmia Detection through Modular Neural Networks
In this presentation, Meryll Dindin (with collaborators Yūei Umeda and Frédéric Chazal) introduces a novel approach for detecting and classifying cardiac arrhythmias from ECG signals by integrating Topological Data Analysis (TDA) with a shallow, modular neural network architecture. The talk begins by highlighting the public health impact of heart disease and the challenges posed by individual variability in ECG waveforms. It then explains core TDA concepts—persistent homology, barcodes, and Betti curves—showing how upper‑level set filtrations of ECG beats can be transformed into robust, time‑invariant feature vectors. After describing the preprocessing pipeline applied to the MIT‑BIH arrhythmia databases (resampling, drift removal, filtering, scaling, and beat segmentation), the speaker details an autoencoder trained solely on normal beats to address class imbalance, using its reconstruction error as an additional feature. The central contribution is a multimodal shallow network that concatenates (i) Betti‑curve CNN embeddings, (ii) raw‑ECG CNN/autoencoder latent embeddings, (iii) FFT coefficients, and (iv) extremal point features, followed by a fully‑connected classifier. Experiments employ patient‑based cross‑validation (15‑patient validation, 225‑patient training) across 48 folds, reporting 98 % mean validation and test accuracy for binary arrhythmia detection and superior performance on a 13‑class classification task. Benchmarks against prior works (e.g., Li et al. 2018 and several specialized arrhythmia classifiers) demonstrate state‑of‑the‑art or better results, confirming that TDA‑derived features improve generalization. The talk concludes with reflections on the modularity of the architecture, potential extensions (e.g., wavelet channels), and the broader applicability of TDA to diverse data modalities.
Chapters
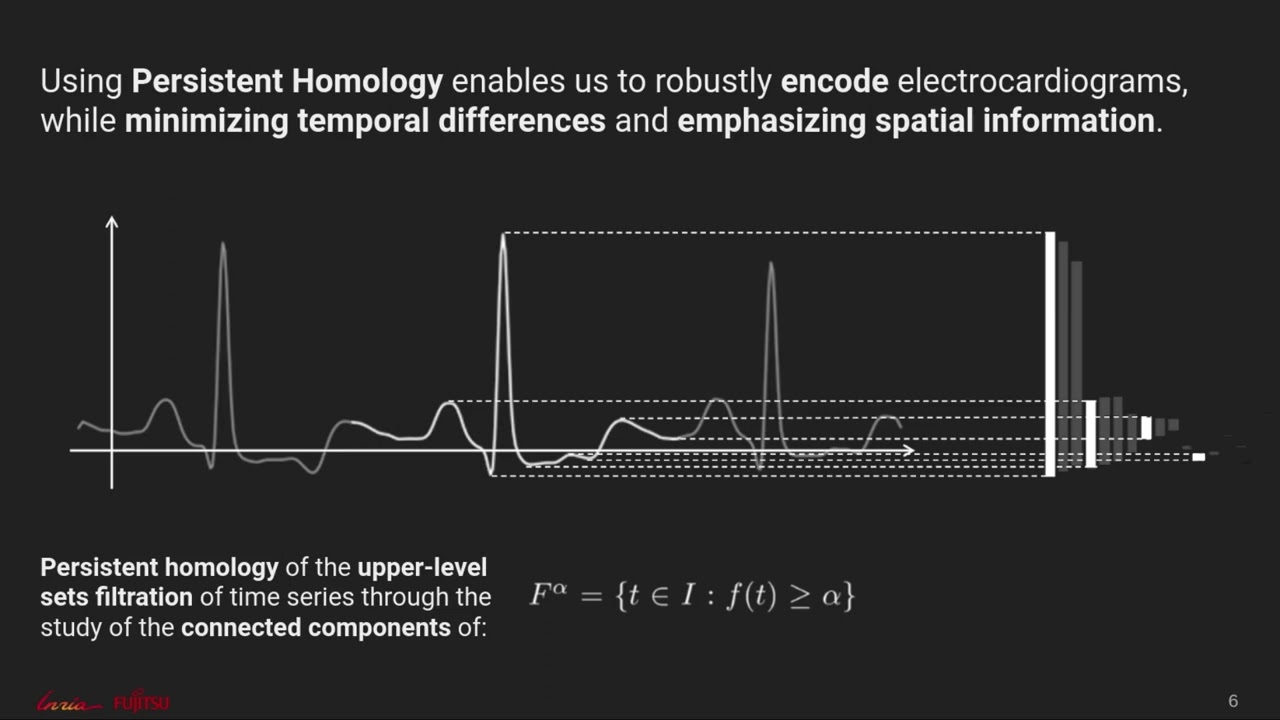
Hi everyone, my name is Meryll Dindin and today for the Canadian AI 2020 Virtual Edition, I will be presenting a work with Yūei Umeda at the Fujitsu AI Laboratories in Tokyo and Frédéric Chazal at the Inria in Paris. The paper we are presenting today, entitled Topological Data Analysis for Arrhythmia Detection through Modular Neural Network, is originating from active research on the field of applied topology to machine learning. Throughout this video, I will be presenting the results of a work dedicated to the monitoring of heart conditions based on the analysis of ECG signals. Even though we focused our attention on both the detection and classification tasks, our major claims deal with the inherent issues of individual differences. That led us to the construction of a multimodal shallow neural network that I'll be presenting in the coming slides. And the novelty of our approach relies on using topological data analysis to robustly describe heartbeats and diminish the impact of individual differences. I will conclude this presentation with different benchmarks and finally show that AURML reaches state-of-the-art scores and above for both detection and classification. Aside from the promotion of topological data analysis that I will refer to as TDA, Here, used as a proxy for high-quality features for deep learning models, our main focus is really about applying it to a field where performance increase has a huge impact on human lives. It is important to highlight that heart diseases are one of, not to say the top, leading cause of death in the US. 12% of the US population alone has been diagnosed with one heart condition, which leads to a death every 37 seconds on average. Monitoring and diagnosing those has been increasingly important, even more when you realize that 1 in 5 heart strokes actually goes undetected, ultimately harming the body without the person even noticing it. The good thing with monitoring the heart is that it follows a very recognizable pattern, and that signal will most likely occur more than a billion times in your body. The two sections of this internal pump will synchronously attract or eject blood, giving to our heartbeats a very recognizable pattern. Once this pattern is decomposed, we consecutively observe a P wave, corresponding to the activation of the atria, then we see the QRS complex for the activation of the ventricles, and finally we see the T wave, representative of the heart going back to its initial state, that we also call recovery wave. Now, not all those billions of heartbeats do exactly follow the same great pattern, and when it does not, the signal we gather from it is obviously different. This is what we call arrhythmias, which is more or less an umbrella term for all those abnormal heartbeats. The difference itself can come from the shape of the monitor heartbeat, as would an abnormal P wave lead to atrial fibrillation, for instance, or an abnormal T wave could potentially be the sign for myocardial infarctions. But it can also come from the frequency of these heartbeats, linking to more popular conditions such as bradycardia or tachycardia. And because the latter is easier to monitor through peak detection algorithms, for instance, we ended up very interested in the way to represent at best the information about the shape of these heartbeats. This is exactly what led us to the introduction of topological data analysis to help us in our classification tasks. But hey, what is TDA, or topological data analysis? In a nutshell, that is a recent and growing field providing mathematically well-founded methods to exhibit topological patterns in data and to encode them into quantitative and qualitative features. One of its core blocks is known as persistent homology, which is a general mathematical framework to encode the evolution of the topology of families of specific nested spaces,, as would filtered complex or sub-level sets be. It also has a lot of stability properties that we will actively be exploiting in order to reduce the impact of individual differences and thus aim towards better generalization. Among the multiple elements constituting this theory, one may have already heard of persistent diagrams, persistent barcodes, birth and death radius, and others. Here, here is a little example to illustrate what a persistent barcode is, for example. So take a 2D point cloud, create a circle around all of these points, given a centers, and give them a radius that they all share. Grow the circle synchronously. As soon as the circle intercept one another, then you have created what you call a connected component. This event will be recorded as the birth radius of the created component. Now keep growing it. As soon as your component merges with another one, then you have destroyed the smallest one and you create a bigger connected component. That is the death radius of the previous destroyed component. The bigger component keeps living with birth radius being the smallest of all. Then we will ultimately reach a point where all components have merged together, and that will be the death radius of your biggest component. And this birth and death radius end up being the new 2D representation of your point cloud, either displayed in a persistent diagram where both radiuses are either waxed in x and y-axis, or in a persistent barcode as shown here in this example. Different dimensions for the purpose of presentation, but we'll see the next slides where to limit our analysis. This was a basic example of a featurization through persistent homology. Now let's dive back into our problematic of arrhythmia detection. As I said previously, what we were interested about is the shape of those heartbeats. Let's see what TDA has to offer in terms of topological features and pattern extraction here in a classic ECG signal. For the sake of this example, we will only consider the upper-level set filtration and study, as we saw it previously, the evolutions of the connected components of the signal through a persistent Berker representation. Upper-level filtration means that we begin at the top. First, birth rate, creation of the first component. We then decrease alpha, similar to increasing the radius on the previous example, and end up there, where we have to create a new component not connected to the previous one yet. We continue decreasing the value of alpha, end up facing more and more pieces of this signal creating, merging, creating, merging, and finishing the featurization. What we obtain there is called the Burke diagram of a single heartbeat. Obviously, for the sake of our problematic, these diagrams can be created on consecutive heartbeats, as shown here with 3, because sometimes abnormality or arrhythmia is actually defined by the relationships of one heartbeat with either the one that preceded or the one that followed. So very important to take all that information into its context. Unfortunately, Barkow diagrams are a set of values, and as we all know, sets are not interfacing very well with standard machine learning methods yet. We thus had to transform or process the Barkow representation into a standardized input that traditional methods can use. For that purpose, we introduced the Betty curves, But like, how to build them? What are Betti curves? So let's consider a persistence barcode for which we vectorize the radius space. Each component of the barcode diagram is then referred to as a function taking 1 as value on the radius defining it and 0 anywhere else. The sum of these functions defines the Betti curve. An example of that transformation is here on the slide. Now remember, we decided to go with that example for upper-level filtration But we could have gone for the sub-level filtration as well. Applying the same methodology, we end up creating another Bézier curve representing the other filtration. These have multiple advantages, theoretical or practical, of using Bézier curves. First, you, you control the sampling of the radius space, so your Bézier curve will have as many points as you need, which also means granularity can be represented to its best. It also greatly helps, as we may see with noise reduction, by keeping the bigger patterns and putting thresholds on the components you do not want to keep. TDA offers thus both an interface for global patterns as well as detailed ones. But that is not all. Bad echoes are time independent, which is in retrospective very useful to deal with different heart rhythms for each individual. Now, the theorem we exposed there tells you two things: First, time dilation or contraction has no effect on Betti curves, thus making tachycardia or bradycardia less of an issue for machine learning. Second, amplitude scaling proportion is transferred abou— among Betti curves, which enables us to reduce issues linked to amplitude scaling. Great, now that the theory has been introduced, let's dive back into the problem. To support our claims of generalization regarding arrhythmia detection and classification, we had to aggregate data which was benchmarked in the literature. The MIT-BIH databases were the most extensively studied, so the best targets. They consist of 5 databases with a total of 240 patients and 3.5 million thread bits that were labeled by 2 or more clinicians. As per our preprocessing, we went the following route, already pretty well described in literature. Starting with a resampling at 200 Hz, a baseline drift removal, a finite impulse response and Kalman filter application, a min-max scaling with a distribution standardization, an ECG splitting in consecutive heartbeats, would it be 1, 3, or 5 for the previously exposed reasons, and a classic feature engineering. By the latter, I mean extraction of extremis or Fourier transform, for instance. Well, that being said, the first observation we made is that the amount of normal heartbeats in those databases compared to abnormal heartbeats is hugely imbalanced. We just decided to see if there was an easy path for arrhythmia detection through the exploitation of that imbalance. Among the possible ways, the use of other encoders seems all the more appropriate. We thus trained an autoencoder under a cross-validation framework based on cohort splits and not sample splits, keeping only the normal samples as part of the training and testing sets. The remaining validation set was composed of all our abnormal heartbeats and the remaining patient's normal heartbeats. A graph of the obtained reconstruction error is given here under. Well, as one may see, there is a shift in the reconstruction error distribution for normal versus abnormal samples, But unfortunately, that is not enough to be a classifier by itself, so we rather decided to use it as a feature map in our deep learning model. Regarding the rest of the hints we could find in the literature in this field, it has always been about exploiting convolutional neural networks to deal with both the long-term and short-term patterns in ECGs while working on the tasks of arrhythmia detection and classification. New methods and architectures increasingly tend to stack more and more layers while aggregating bigger and bigger private datasets, which gets hard to benchmark against, of course. An example of such architecture is one of Stanford's papers published last year with the model displayed here, Hunter. We believe that due to the non-practical implications of such models, e.g., medical device embedding or huge training cost, that those performances could be achieved with workarounds and shallow neural networks. Well, the transition requires one to actually provide better inputs to the model than the raw ECGs themselves. But both these two last observations made us converge to the architecture now displayed on your screen. It consists in a multi-model neural architecture exploiting all the elements we have been listing here so far. On one side, we have the Betty curves inputted into network as 1D time series into convolutional neural networks, while the preprocessed ECG signals are fed into both a CNN and/or fully connected autoencoder. The latent space is exploited as a new feature map, while the decoder part of the autoencoder is fed into a subtraction layer into— with the raw input, then fed into the CNN model. Two simpler feature maps added to the concatenation layers, which are the basic features we talked about previously, would be the FFT coefficients extracted from the raw signals or the extremas. In the end, we integrate as a new model both the autoencoder to deal with the imbalance of the data and the Betty curves to enhance robustness and deal with individual differences. Now we had to quantify the impact of using TDA in our architectures and for both tasks. Of detection and classification. For such quantification, we set up a patient-based cross-validation with 15 patients as validation set and 225 patients as train set. The models were, they're trained either by switching on or off the t-channel, meaning that the concatenated feature map fed into the fully connected classifier were either using or not. The TDF features. The, the validation results, accuracy in this case, of both tasks are presented in table here. Would it be for the binary classification task or the 13-class classification task, using the topological features either, in this case, greatly improved the performances, and if not, kept them at the same level than the architecture would have without the CNNs attached to the Betty curves. Ultimately, what it shows is that a great improvement in generalization on both tasks for arrhythmia detection and classification. Now that we had our model described, we had to set up the right experiments to support our claims of enhanced generalization. Based on the 240 patients we have in the aggregated databases, we define a patient-based cross-validation once again. The goal here is twofold. The first, um, one is that test performance will ally our ability to classify patterns we are familiar with, whereas validation will emphasize the ability of our model to generalize on totally unknown populations. Regarding parameterization, each validation is made of 5 patients randomly selected, while training and testing sets are made of 235 remaining patients. Which accounts for a total of 48 rounds of validation. Part of the first experiments we ran with that configuration was evaluating our ability to detect abnormal heartbeats. We here obtained a 98% mean validation accuracy and a 98% mean test accuracy. Unfortunately, literature does not provide benchmarks to compare those results with anything, so we had to find elements to benchmark with. One of the first benchmarks we went through comes from Li et al.'s paper published in 2018. There, they do two noticeable experiments regarding the detection of premature ventricular contractions, which are only a specific subset of arrhythmias. Without contesting their methodologies, they take the MIT-BIH arrhythmia database only for the first experiment that they split into two subsets, one for training, one for validation. In those circumstances, very few samples on both sides, our model still keeps up with their performances. Nonetheless, it becomes interesting in their second configuration, because by aggregating all these 5 databases, they split the 240 patients in 2 subgroups, which means more samples on both sides, one for training and one for test— for validation as well. There, our model outperformed theirs, showing better generalization over a consequent amount of samples., which was the goal of this study. A bigger benchmark comparison we will also introduce here comes from the aggregation of multiple papers targeting the classification of only specific classes or subgroups of arrhythmias. They generally pick the most representative and less complex classes and execute a patch-and-blaze cross-validation of those. In our case, by strictly following their methodologies, We outperform all the models presented in the papers in Render through the same metrics they used. This final remark leads us to our conclusion. So we developed a new approach to deal with the issue of generalization in arrhythmia detection and classification. Our innovative architecture uses common source of information, topological data analysis, and autoencoders. We supported our claim of improved generalization, which scores reaching the performances of state-of-the-art methods and above. Or experiments pinpoint the strength of TDE and other encoders to improve generalization results. Moreover, the modularity of such model allows us to build and add new channels, such as possibly, why not, adding a wavelet transform channel, which also gives a good description of the ECG's time series. And finally, we also gave a new benchmark on 5 open-source datasets and get excited by performance improvement through e.g., the release of Lazer datasets such as presented in the Stanford paper, where they collect and annotate a dataset of 64,000 ECG records from 29,000 patients. TDA thus opens up a whole new interface for machine learning problems where data can be represented through persistent homology, whether it be diagrams or percodes. Examples of those are 3D point clouds, graph structures, multimodal time series, and so forth. I hope this presentation got you to ask more questions than it solved, and would be more than happy to answer all of those. Feel free to contact me on my email address, and thank you for listening.