0:58
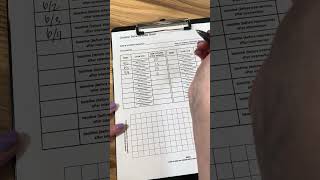
A walkthrough of a data sheet that tracks how long behaviors last. Input your 30-minute observation notes, and the sheet graphs the results across days so you can show parents exactly how an intervention is working.
A walkthrough of a data sheet that tracks how long behaviors last. Input your 30-minute observation notes, and the sheet graphs the results across days so you can show parents exactly how an intervention is working.
One thing I really love about this data sheet is the embedded graphing component on the bottom. After you add in all your data, then on the bottom you can add a graph, which is really nice to see that kind of behavior changing in action. So let's say we have, um, some different sets of behavior here. I'm just going to make up some data real quick over a few days, and we're, let's say, taking data during a 30-minute time period because this is duration data. And then we're gonna add on the bottom really easily, we're going to graph. So we're gonna look at— we're gonna add this graph in and we're gonna be able to really nicely see our trends over time, which is really cool. I think this is really nice to show parents and be able to see if our interventions are working and see that progress.