Google Forms BASICS: Using Google Forms for Special Ed Data Collection
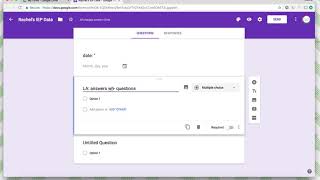
Sasha shows how to set up a Google Form to track IEP progress for a student named Rachel across language arts, math, science, social studies, and social-emotional goals. The form automatically collects daily data from paraprofessionals and teachers, then generates summaries and trend visualizations so you can see progress at a glance.
Chapters
Hi, this is Sasha from theautismhelper.com, and this is a very brief basic tutorial on how to use Google Forms. So I have some other more in-depth tutorials on Google Forms, but this is kind of just the basics to introduce, to introduce exactly what Google Forms is and a little bit of like the setup process. So Google Forms is a tool that's part of Google Drive. If you have a Gmail, you have access to it. You can use this anywhere on any device as long as you have the link, so it makes the whole process very easy. So to set up your form, you only have to do this once. You'll want to add a new form, so you click on New and then Google Form. So you only have to set up the actual form once. Once it's all set up, everyone adds their responses. You can copy the link, send it out to people, bookmark it on your classroom computer, whatever you want. So the setup process is quick, but it really only— you have to do it once, so it's pretty great. So I'm gonna set up some IEP goal data for a student named Rachel. So I'm gonna put Rachel's IEP Data is the title of the form. Um, and here is where this will automatically update in a minute, the title of the form. There we go. And then you can add in all of your questions. So Google Forms is basically a survey. People can submit answers to different questions. The questions here are going to be the academic IEP goals, and then it will help you analyze and view and process the responses. So here it will be the data. So this is really a tool for analyzing the data you take. When I post about this in the past, people are like, oh, but I love paper and pencil the best. I agree, I still take data on paper and pencil, but then input it onto the Google Form so you can best view the goal, the data. If you have paraprofessionals taking data and you taking data, you can see everything in one spot. So here's Rachel's IEP data. I'm gonna put for the 2018-2019 school year. So give a little bit of information. You can add the picture of the student if you want, make it all personalized. So there's the first question. So there's the first note, and now we're gonna add the questions. So here, everything kind of, if you hover over it, will pop up what you want it to be. You can make this as simple or as complicated as you want. I like to keep it pretty straightforward. So I'm gonna add my first question, and the first question I'm gonna put here is the date. Because we're gonna want to know what day the data was taken. So date, and then the format right here, month/day/year, is already, is already in. And I'm gonna make this one required because I'm gonna want to know every single day, you know, what data goes from with which, with which results. So the first one here is the date. So then I'm gonna add the next question. And so this option of required or not required is nice for something like IEP goals because you might not work on every single IEP goal every day. So you don't have to answer each question, you could just answer the ones that are applicable. So let's say I'm gonna put my language arts goal. So my language arts goal is answers WH questions. And some other information I'm gonna put is maybe the mastery criteria. So I'm gonna put 10 trials I want here. So now I have some different options of types of answers that I can give. You can give multiple choices, checkboxes. Here I'm gonna do a linear scale between 1 through 10 because I have 10 trials, so I want to know how many she got correct. So I can just put how many we got in each one. That's the language arts. Math, the goal here, let's say, is identifies numbers. 1 through 10. So now I can pick another option, and I'm going to pick— let's see, wait, let's say we have to do 10 trials of this again. So I'm going to do that linear scale one more time through 10. It's a little confusing because 1 through 10 and 10 trials, but whatever, we'll work on that. All right, so next is her science goal, and her science goal is identifying Body parts. And the body parts that we're working on, I'm gonna— I want to know specifically which ones she gets correct. So the body parts we're working on are neck, head, arms, legs, and let's say feet. So we're working on 5 body parts. I want to know each day which ones she gets correct. You can check, check, check which correct. And then our social studies goal is identifies— or this will be follows directions in the community. And I'm going to do a multiple choice here. So this is she needed zero prompts, then she needed 1 to 2 prompts, and here she needed 3 or more prompts. So I can track the prompting level right here. And her communication goal— so I'm gonna do social-emotional goal— is, let's say, I didn't prep these guys, think of these on the spot, she will greet peers. So options are independently greets 2 or more peers a day, independently greets 1 peer, does not independently greet any peers. So I want to know the criteria here we're working on is how many peers she's doing. Alright, so those are my basic goals. I had a language arts, a math, a science, social studies, so social-emotional with different types of answers. So we're all done. So that's it. You don't have to click save. It always kind of worries me. You're like, oh shoot, what do I do? That's it, you're finished. So now you send this. So you can email it to yourself, or you can just keep the link right here. You can embed this if you have like a school website or something like that that you all use. Click shorten URL. This one's pretty long, so I like to click the shorten URL and then keep this link. So I'm gonna go into a new tab and to show you how the responses look. Okay, so we set up all Rachel's data, the school year starts, it's Friday, I have data that I've taken paper and pencil throughout the week, and now I want to Friday afternoon, I really want to get home, but I want to put this data in. So what am I going to do? So I go to her response page. So this is that link that I just opened, and we're going to submit her data from the week. I'm just going to do a few days here to show you. So let's say this was last week, so I have Monday's data. Her, um, WH questions, she did really good on Monday, she got 9 out of 10. Her math, she struggled, she only got 5 out of 10. For working on science, she got all correct except her arms. Social studies, we didn't work on that day. Social-emotional, she independently greeted one peer. Submit. Cool. Now I'm gonna do Tuesday's data. So fill in the date, this was from last Tuesday. She did awesome on her WH questions, a little better on her math. She got all of those science body parts. We did work on the social studies, but she needed 3 or more prompts. She independently greeted 2 or more peers. Submit. So that was just submitting 2 days of data. That took me, what, 20 seconds, right? So now this is automatically here. See, I have 2 days of data in my responses. This is going to summarize everything in a way that's just really easy to see. So language arts, okay, she got half the time she got 9, then the other half the time she got 10. Same thing with math. We don't have a lot of responses yet, but once you get more responses, when you have like 10 or more response days that you've inputted data, there's a ton of variation. So you can really see where the trend is. Identifies body parts, see which ones she's struggling with. Social studies, obviously we only did this one time, so I know that this is how it was. And then social-emotional. So you can see like as we get more data points, we're gonna get more information. I'll show you all the days that you took data. So just really simple. So this is a pretty like I said, straightforward basics on Google Forms. I have some other ones that get more in-depth in graphing data, utilizing data, other ways to use this. Hope you found this helpful. This is Sasha from theautismhelper.com.