Sasha from TheAutismHelper.com shows the Visual Temperature Bar Graph, a classroom tool that lets all students, including non-verbal learners, participate in graphing. The kit includes laminated pages, Velcro-backed pieces, and a visual key. It aligns with Common Core and builds higher-order thinking during morning meetings.
Chapters
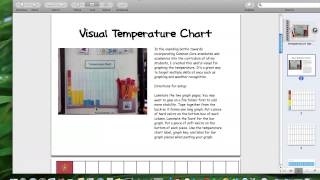
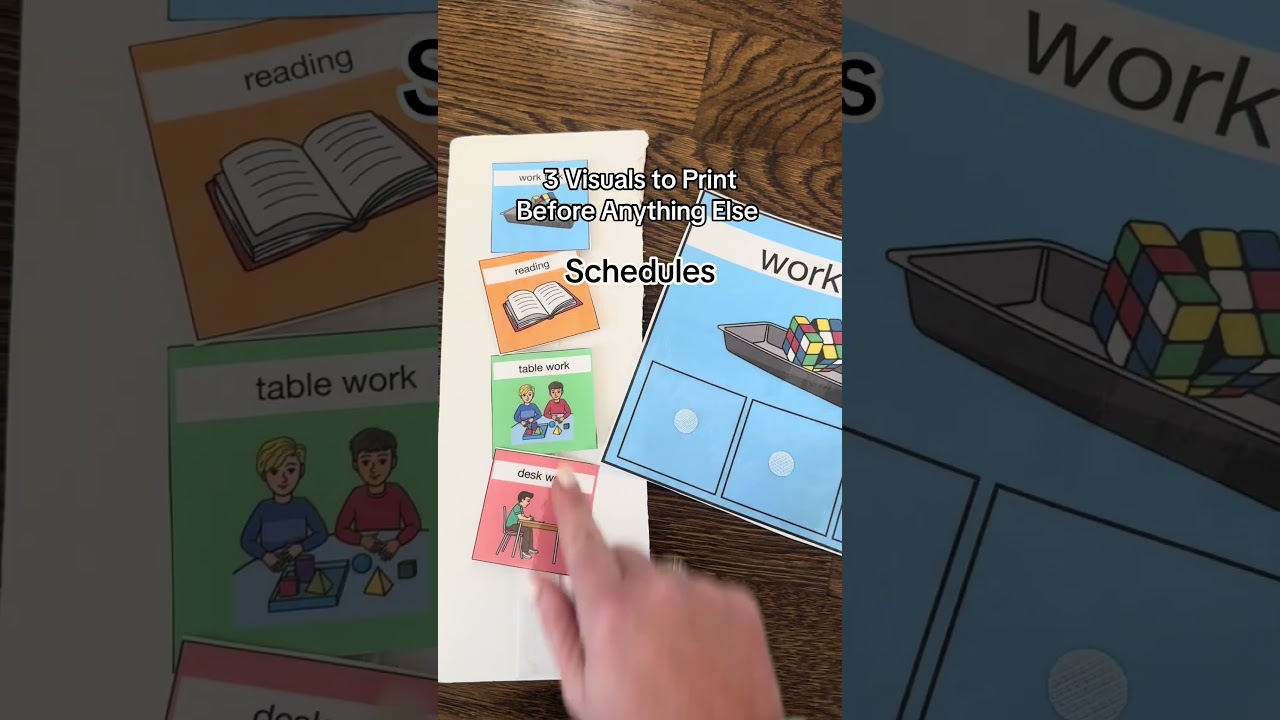
Hi, this is Sasha from TheAutismHelper.com, and this is a product preview of my Visual Temperature Bar Graph. So I've gotten a ton of emails and requests for making this into a product, so I finally got around to it. I— this is one of the things I absolutely love about my morning meeting time because it's a great way to involve kids that are nonverbal or non-writers into a graphing activity, which is such a higher-level skill. So this pack contains all directions for setup and then all of the materials for putting together your own temperature chart. So you'll laminate these two pages. I like to post them, as you can see here, on the back of a file folder and then laminate them and tape them together on the back. So this will be the base of your graph. There is the visual temperature key, and then here are all the pieces. So these will be laminated with soft Velcro on the back, and then just like the picture, students will add the pieces based on the temperature. Um, also included are labels, a temperature key, and then a label for the bar graph pieces. So again, this is a great way to involve your lower-level learners or your learners who are nonverbal or non-writers into a graphing skill. So this is great for incorporating Common Core and those higher-level thinking skills. It's not just matching and matching, it's kind of creating those associations and really engaging in that charting activity. So again, this is a product preview of the Visual Temperature Bar Graph by theautismhelper.com.