Sasha from The Autism Helper shows how to build a Google Form for collecting ABC data on a student. The form captures antecedents, behaviors, and consequences with checkboxes, auto-generates bar graphs, and reveals patterns like 80% of incidents tied to work demands. Five days of data takes under two minutes to enter.
Chapters
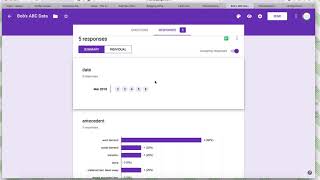
Hi, this is Sasha from The Autism Helper, and this is a video tutorial of using Google Drive to analyze ABC data. So I'm going to show you how to set it up, and then I'm going to show one that I already have filled in with data. So you want to go to Google Drive and go to New Form, and you will start a new form. You only have to set up the form one time. Once it's done, you just submit the data and it's ready to go. So let's call this Allison's ABC data. So we're gonna add really only 4 questions here. You can get more detailed. I'm just gonna kind of go with the basics here. So I'm gonna put the date. I'm gonna add another question. I'm gonna put the antecedents. So this is what happens before the behavior. What I want here is checkboxes because there might be multiple antecedents. So I want to be able to add multiple options. So one, I'm gonna do all of the common antecedents for Allison's behavior. One's work demands. Oops. One is social demands. One is transitions. One antecedent is just her— is her being alone. Alone. Another one is a preferred item taken away. And the last option is denied a requested item. So those are things that commonly happen before Allison's typical behavior. So this is a required— I'm gonna make this required. I'm also gonna come back up here and make my day required because I, I don't want to allow anyone to submit data, whether it's another staff member, without putting the date and without putting an antecedent, a behavior, and a consequence. So the ABCs. So now we have behavior and And here I'm really not going to get into frequency, I'm just going to look at what behaviors happened. So her common behaviors are hitting, um, kicking, pushing, uh, yell, and all of our favorite fall to floor. So I'm not looking at frequency, I'm just looking at what occurred. So again, required. And then last question, the consequence And again, checkboxes. And then I'm gonna do the common things that happen after her behavior. So she's ignored, she is given prompts or redirected, she is given break time, she is given a timeout. And that's it. So you only have to do this one time, and that took me literally a minute and a half. So this is super, super easy, putting in all the common antecedents, behaviors, and consequences. So you'll be taking this data on paper and pencil. I'm not advocating during a meltdown to pop on the computer and put this all in, but this will be later. You'll be transferring your data into the Google Form. So how you do that is you can send the link, you can email this to yourself, you can get the actual link right here, you can bookmark this on your school computer so everyone can do it and have access to it all the time. So I'm going to show you some data that I already filled out. When I do a full-day behavior or data session in PDs, I actually do this real time. Like, we set up this exactly like I told you, and then we submit 5 days of data because I really want to show that this is so fast. I've actually had in PDs people time me to see how long I can do 5 days of data, and it takes less than a minute and a half. So this is very quick. If on a Friday afternoon you're like, oh shoot, I didn't put any data in, you could easily put in the 5 days of data, and this is going to give you a lot of valuable information. So I already submitted my 5 days of data, and this is what the end result looks like. So of the 5 days of data that I did, 80% of the time a work demand was involved. Okay, that's pretty interesting. That's giving me a lot of great information about what is causing this behavior and what's triggering this behavior. We see that hitting is the most common response, and then we see that a lot of times there's prompting or some type of break, because remember timeout's a break. So this is also giving me information that there's maybe an escape component to this behavior, maybe an attention component. We want to maybe take a little bit more data to figure it out. So this is what this end result looks like, which is pretty amazing. So like I said, submitting the data is really easy. I'll do one more day right here. So I'm gonna add the date. Here, I'm gonna go over here to this guy that I sent it with. I'm gonna copy the link and open it right here. So I'm gonna put the date in. So let's say this was March 8th. This behavior, there was a work demand, she hit and pushed. The consequence, she was ignored. Submit. So literally that's how long it takes. It's the date and a few clicks and that's it. So if you're using a checklist ABC data sheet, which I really recommend, This is super easy to transfer, and you're going to get so many great results here from doing this, and this will just continue to populate. So, you'll kind of keep adding new data, new data, new data, and we'll see these different responses. You can also turn this into a line graph like I showed in the other Google Forms video that will kind of show you, again, some different versions of this, but I actually think the bar graphs, to me, are— they're simple, but they're very helpful because they're going to highlight some information. This would be great to show a parent, a clinician, your staff members, because because this is going to illustrate something a little bit better than you just explaining it. So again, this was a brief video tutorial on how to use Google Forms for analyzing ABC data by theautismhelper.com.