RSS Seminar with Richard Riley
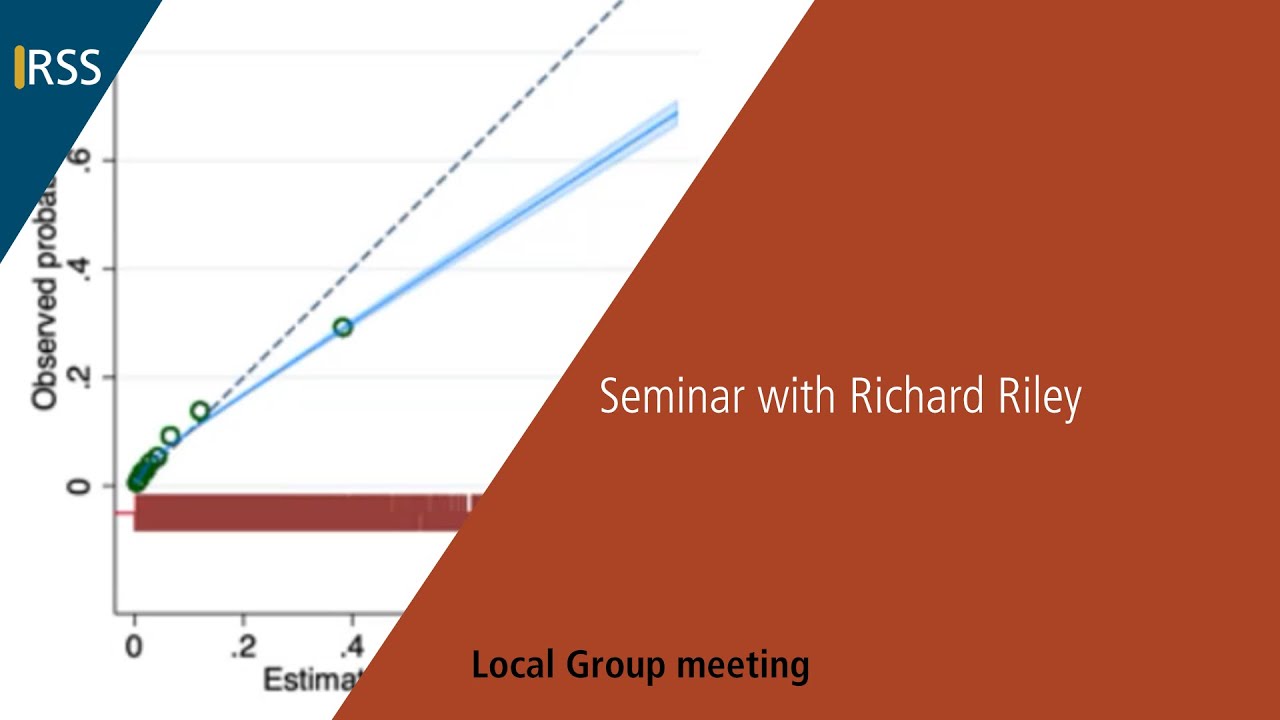
Richard Riley covers prediction modeling in healthcare, from calibration and discrimination to why most COVID-19 models were high-risk for bias. He shows how bootstrap resampling reveals unstable predictions, explains sample-size guidance through PMSampleSize packages, and advocates for pre-registration, validation before development, and the TRIPOD reporting checklist.
Chapters
This is a very much long-awaited visit by our Richard Riley.
Thank you.
I hope you recognize the our. We're very possessive about you. So yeah, it's been in the making for about 5 years and had hiccups along the way, but we are finally here. which is fantastic. Richard from the Statistical Fraternity should need really no introduction other than the fact that he's recently moved from Keele to Birmingham. Prediction models is, as far as I'm concerned, the thing that he's most known for, but he has a wide spectrum of expertise. Apart from that, he's just a very nice chap. Well, so, you know, he's blushing like mad at the moment, but he's here today to talk to us about prediction models, hurrah, in healthcare, and it's a playground for researchers.
So, Richard, we look forward to your talk. Thank you so much. Oh, what's happened? There you go. Thank you so much, and thank you so much for the invite. This is hopefully going to be fun in some ways, but also very serious in others, about an area that I work in, in prediction models. So just hands up if you work or have done any work at all on prediction models in healthcare. So a few, 4 or 5, but all of us at some point Well, as a patient or as a family member come across a prediction tool that influences their medical care or treatment or decision-making or some lifestyle intervention choice or whatever it is. For example, when you get to 40, for those of you at 40 will know that get sent a letter by the GP to come for a routine checkup, and you'll be Q-risked.
In England?
In England, yes. Anything equivalent here?
No, we get the— when you hit 60, everything happens.
Who told you? Okay, so yes, I must thank Gary Collins from Oxford. Gary and I do a lot of work together, and some of these slides and topics are interchangeable with what we're doing together. Gary is a Scotsman. No, he's not. Obviously don't know him that well. Definitely got Scottish accent. I put a question mark there. I don't really need a question mark because this area is a playground for healthcare researchers. There's no doubt about it. And I'll talk today about why that is and come up with some potential solutions. But here's a quote from Galen in the 2nd century. Patient trust was essential in the healing process. It could be won by a punctilious bedside manner, by meticulous explanation, by a mastery of prognosis—an art demanding experience, observation, and logic. Mastery of prognosis, mastery of prediction—we are miles and miles away from that. We're not even applying the basic principles right at the minute. So let's just go through why that's the case. An introduction to prediction models in healthcare. So when I talk about a prediction model, what I mean is some statistical equation, a regression model, or it could be a black box like a machine learning algorithm, a tree-based system which utilizes multiple variables, which you may also know as prognostic factors or predictors. covariates, features, to estimate and predict an outcome or an outcome risk in an individual participant. So like I was saying about QRisk, QRisk predicts an individual's 10-year CVD risk conditional on their blood pressure, their age, their body mass index, whether they smoke, how much alcohol they drink, etc. So clearly when we make a prediction, we want it to be useful and accurate. So we want it to inform healthcare professionals and patients in a reliable way so that it maybe guides healthcare decisions that ultimately improve outcomes. And we may even use these models to improve clinical research. For example, within trial randomization, we may use the model to help look at balance between the groups. This is not population-level predictions. This is individual-level predictions, making decisions for individuals, and that's important to think about. So here's an example of a web app which behind the scenes uses a logistic regression equation, but it could be anything. It could be a machine learning approach, and you enter the predictors of country, age, Glasgow Combs score, and reactivity light, and this is an individual who's had a traumatic brain injury, and this prediction equation behind the scenes will give you for this individual their risk of 14-day mortality, which is 14%, and a risk of unfavorable outcome by 6 months of about 50%. So this is an individualized risk estimate. So in people with these characteristics, we expect 14% of them to have not survived at 14 days. And they are hot topic. They are used in practice. For example, these are NICE guidance which have recommended the use of a prediction tool. So I mentioned about QRISK, there's the Nottingham Prognostic Index, FRAX tool, the Apgar score— newborn baby, get the Apgar score straight away. the Leicester Diabetes Score, and many, many others. We need these models to be reliable, and by that I mean that the predictions that we are getting from them should be as accurate as possible. Therefore, when we have developed a model, we should know the performance of those models. In particular, does the estimates— I'm just going to focus really on estimated risks— do the estimated risks calibrate well with the observed risks? So in individuals who are predicted 20% risk, do we see that about 20% of them do have the outcome? Can we separate out well? Can we distinguish between those who will and will not have the outcome? We could give everyone the same risk equal to the outcome prevalence. which would be well calibrated at that overall population level, but it's useless because it's not distinguishing between anyone. So we want predictions to span the range really from 0 to 1 and be as discriminative as possible. And beyond these measures, can we show that the model has clinical utility so that if we use the model to make decisions, for example, with Q-Risk, if your risk is greater than 10%, you tend to be put on Now, is that strategy— does it have utility? Does it lead to improved patient outcomes? So we need to understand this. We need to understand it in validation studies that are checking the performance. Statistically, this means that we need robust statistical measures and approaches. First of all, to check calibration with calibration plots and calibration measures. Discrimination measures such as the area under the curve, or also known as the C-statistic, and clinical utility measures, which are also known as net benefit and decision curves. This all requires careful statistical modeling and assessment. You won't be surprised to know that most prediction models are developed without any statistical expertise at all. Calibration is something I want to emphasize because it's neglected in practice. So I've talked about what calibration is, but this is an important visual display of this. So on the x-axis I've got the estimated risk, and on the y-axis I've got the observed risk. And for this model, which is a prediction model for 30-day mortality following acute myocardial infarction, I've grouped into tenths of the predicted risk and looking to see how it calibrates. So for this group here, They were predicted about a 40% risk of having the outcome, but the observed risk in that group was about 30%. So there's some miscalibration here. It's about 10% over prediction. The ideal line of calibration is this 45-degree line. Down this lower end, it seems to be quite well calibrated. But at the upper end, there seems to be some miscalibration. And this blue line is what's called a calibration curve. This is not fitted through those 10 groupings, it's fitted through the original data points. So it's a curve based on the individual predictions versus the observed outcomes, 1s and 0s, and it's fitted a smooth nonlinear relationship through it. And we can see that clearly, as the predictions get higher the miscalibration gets worse. You know, the observed risks are much lower than the predicted. We can summarize this plot by statistics like the calibration slope. That's the slope of this blue line, essentially, if you were to fit a linear trend through it. That's 0.72, ideal value of 1, so it's too low. And the O/E, which is the overall observed and the overall expected deaths, that's pretty much close to 1. So on the average, it's well calibrated, but clearly there's some issues up here. Now, does that matter? It might not. If clinical decision thresholds are down here, it might not matter that somebody with a predicted risk of 90% actually only had a 60% risk. It might not matter. They're a high risk regardless. But if your thresholds are up here for some reason, then it might matter. So What I'm saying is that the importance and relevance of prediction models and predictions really depends on the clinical setting and context. This is also true with a measure of discrimination called the area under the curve, the C-statistic. Here it's 0.81. Is that big?
It really doesn't—
it's context-specific. I can't say. 0.5 is just by chance, 1 is perfect discrimination. In some fields, a C-statistic of 0.6 might be good if you struggle to discriminate between people. However, as a diagnostic prediction model, you'd be wanting C-statistics to be close to 1, really, not 0.9. So it really depends on the setting and what information is already known and how this therefore might respond. But that plot, I think, really tells you so much, and you rarely get plot like this. You normally get the z-statistic, but what that means is— so, playground prediction. I thought you'd like this. This is a quote from Steve McLaren when he was England football manager. We have to reduce our expectations of England, and we have the players to do it. It's a genuine quote, and he really succeeded in doing it. But the same is true of prediction models. We really have to reduce our expectations about how any of these prediction models perform. There are hundreds and hundreds of models out there. 400— so these are all reviews that have been done. 408 models for COPD, 363 models for cardiovascular disease, 37 models for treatment Response in pulmonary TB, 30 models for low back pain. You know, whatever field you're interested in, there'll be a model already out there, if not 10, 20, 30, 100. Very few of these models have been validated, i.e., checked in terms of their performance in new data. Like I said, calibration is rarely examined, clinical utility is even rarer. In terms of its assessment. What's going on? Well, models are easy to create. People just have a dataset, they've got SPSS, some, some, and it seems to be that this may be the first thing they will do in a PhD or in a fellowship, or there's something going on behind the scenes where this seems to be the field where people think Ah, because I've got this dataset, I can just quickly develop a model and hey presto, I've got a paper. And that's the way— it's really not how we should be doing research, but this seems to be the problem. Most of them we can't trust. Some of them actually could be harmful. You know, if you're making decisions for individuals on their prognosis and that prognosis is not accurate, then that is not going to be Now, during the pandemic, there was this opportunity really for prediction models to take center stage. Um, just realized, am I— are we looking at the crowd? I think I'm looking at the crowd rather than— what, presenter tracking? Presenter tracking? Yeah, that's where we want to look at you. There we go. So we, we're— yeah, we don't have to stay awake.
Yeah.
So the pandemic started. Laura Winans and Martin Bunce-Smeden decided to start to quickly do a systematic review of the prediction models that were being proposed for COVID-19 diagnosis or prognosis. And we got a big team of people together who had experience in prediction modelling and doing reviews in the field, and we ended up publishing the very first living systematic review in the BMJ. This was actually first published in, I think it was Does it say there? I don't know, it might be in a minute, but it was very quick. It may have been like April 2020, so yeah, only a few months after the pandemic had started. And over the next 2 years, we updated it. And like I said, it's the first living system us review in the BHA. The idea was to review and critically appraise published reports and preprints, because at that time it was mainly preprints, of models for diagnosis or prognosis in COVID-19, or identifying people in the general population at increased risk of infection and hospital admission. And models like this were important for, for example, prioritizing vaccine. So by July 2020, 169 studies have already been published proposing 232 prediction units. Unbelievable. We did a risk of bias assessment. That's a check of the quality of these. This is subjective in some aspects, like any risk of bias, but you can clearly see some real problems. So in the participants domain, 42% were at higher risk of bias. 25% unclear. Key problems: non-representative of the target population. So for example, they didn't recruit consecutive individuals. These are sort of very selective sampling. Some of them didn't have any COVID-19 patients at all. They just used simulated data. In the predictors domain, again, some issues of risk of bias. Some of the models were not using predictors that were available at the time the model was intended to be used. So they were using information post the point at which the prediction would have taken place. The outcome domain— some predictors were part of the outcome definition, so no wonder it performed well when the predictors in the outcome domain were similar. And the analysis domain, 94%— so this is the stats bit— 94% of high-risk buyers, many of them small sample sizes. We know small sample sizes are not great. We'll come back onto this later. At least the overfitting of models, chance findings, okay, that's going to happen, but at least try and adjust for it and model it. People didn't do that. Dichotomization of continuous predictors. People didn't report calibration assessments. He had no idea these models were calibrated. People fitting models to situations where there censoring, but they didn't account for it. There was no validation. Probably not a surprise, all this, but it's quite soul-destroying to actually quantify it and see it in practice. The final one was published in July 2022. By that point, we started to lose the plot, to be honest. We were focusing mainly on prognostic models, and of 606 models, 29 were low risk of bias. There are some reasonably good models out there potentially, but most than 90% we deemed were high risk of bias. So that's really quite, quite depressing. Here's just a few examples if you want a bit of fun. Here's a model by Guan et al. They used machine learning method XGBoost, which can be a good method. Concluded these features can predict death risk Accurately, right? Sample size, internal validation, 16 events. External validation, 7 events. Got no information here. AUC, area under the curve, C-statistic, 1. Confidence interval, 1 to 1. Because you've got no information, see, you just happen to find those that worked perfectly to discriminate between those with and without the alcohol. Confidence was 1 to 1. It's nonsense, but you can predict deaths. No calibration check. This calibration spin is one. The calibration curve showed a good agreement between the predicted risk and the actual risk. Well, is it? I mean, I'm predicting a risk of 0.1 and the true risk is 0.5, 0.6. Yeah, it's not perfect. This one, good calibration. Hosmer-Lemeshal test p-value was 1. Well, again, it's not well calibrated just because you've got a p-value that's 1 because you've got 3 or 4 events. What does that mean? Doesn't mean anything. I want to see a good calibration, and that's not. So very, very frustrating. Here's a good example to try and be a bit more positive. This was published in the Lancet Respiratory Medicine. Laboratory Medicine by Gupta et al., looking at a model they called the ISARIC4C model. They did an extensive internal and external validation in very large samples. They assessed discrimination, calibration, and clinical utility, and they showed good generalizability across many different settings. This is their calibration plots. Calibration curve looks very, very good, doesn't it? This is them examining the C-statistic and also the calibration, the large— that's like the O to E ratio— and the calibration slope, not just overall but also in Wales, Scotland, Midlands. You know, they've broken it down to check performance in different places. Meta-analysis done, so average them. That may not really mean much, but On average, it's close to 1, close to 0. You know, there's a good interrogation. They're really trying to break it, essentially, or at least be transparent in terms of how it's doing everywhere, not just average. Okay, so clearly there's a lot of problems, and the COVID example there is just an example that is very common in any field that you're looking at. How can we How can we do better? Trouble is, it's very hard to stop making predictions. Paul Gascoigne, I never make predictions and I never will. Inherently making a prediction. 5th of December 2018, I have never and I will not start predicting the future. I don't do predictions ever. Right, it's your choice. An hour later on the radio, I'm a very strong arch-Brexiteer. I genuinely believe we have a bright future ahead of us. Making a prediction. It's very hard to stop people making predictions. In many ways, I'd like to stop all healthcare researchers making prediction models. It's not going to happen. Let's try and educate and do better in terms of our education of these individuals so that when we make prediction models, we do better in the future. So this means better statistical and methodological standards. Let's go through some of these ways we can do things better. Register your projects. So just like any research study, we can register our studies. For example, you can do it on clinicaltrials.gov. We can publish our protocols. for example, in a journal or to publish it online. When you're starting to think about developing a model, stop and first start with a validation of an existing model. Why do you need to publish the 781st model when there's already 780 models out there? Maybe one of them is alright, maybe not, but you know, why Why are you adding to the field rather than saying let's see if we can replicate and validate what's already out there? So start with thinking about whether existing models fit the purpose. You'll all resonate with this, but include statisticians and healthcare data experts in the study from the outset. And the converse of that is if we're developing the model, it's our initiative, work with clinical healthcare professionals to understand why you're developing that model, what's going to be useful, is it, is is there a need for it? How would it be implemented in practice? And then clearly report your findings at the end of your project. In terms of reporting, Altman, who was pivotal to many reporting guidelines, in this quote, good reporting is not an optional extra, it is an essential component of research. And he led with Carl Moons and Gary Collins the TRIPoD reporting guideline for prediction models. So this got 32 items covering about 22 topics for development and validation. We're updating that at the minute to TRIPoD AI, basically to say that this also covers machine learning and any methods attributed to AI, whatever that is, but machine learning-based approaches as well. So people are So the TRIPOD reporting guidelines. Don't categorize continuous variables. Dichotomization is biologically implausible. Why are you dichotomizing at 65? What happens at 65? Why are 2 people, 64 and 65, treated differently? Why are 2 people aged 23 and 64 treated the same? Doesn't make sense. It's been shown that for prediction models, dichotomization leads to much worse predictive performance. So if you think of the C-statistic, you're going to reduce the C-statistic by a certain amount when you dichotomize because you're not optimizing predictive information. Also, the cut points that you choose are just going to be due to data dredging and other concerns. We can rather model nonlinear relationships, for example, using splines, fractional polynomials. Many of the machine learning methods out there, tree-based methods, allow flexibility through sort of multiple categorizations when they're working out the tree-based structures and the branches, which is similar to allowing for nonlinear trends to some extent. Obviously a bit more worried about more overfitting. And the machine learners often say, well, they do better than statistical methods because they allow for this flexibility. And when they do a comparison, they never compare it to a regression model as a nonlinear relationship. They always do a linear trend or something So it's not a fair comparison. Statistical models also allow for nonlinearity if you know sort of what you're doing. And then think about thresholds after the model's been created. So I've talked about those calibration plots and having predictions from 0 to 1. Then you can start thinking about thresholds on that scale, not on the scale of a variable in the model. You know, that's way too soon. It should be on the risk scale at the end. Also go beyond calibration and discrimination. So a model may have high discrimination and perfect calibration yet no clinical role, whereas the opposite may also be true. So a paper by Andrew Vickers, when he's looking at whether we should biopsy patients for potential prostate cancer, so specifying that a patient with— who truly does have lung cancer is at very high risk rather than just high risk reflects that the model is a good one, but makes no clinical difference because the patient would be biopsied in both cases, whether they're high risk or very high risk, they're going to be biopsied. But by contrast, a model with only moderate discrimination might actually be useful if the clinical decision without the model was previously a toss-up. where you didn't know whether somebody had the cancer or not. So it depends on your— what you're looking at and the context of what that model is offering over and above what you already know. If we go back to that graph that we had on earlier, we talked about the fact that there was miscalibration. The Like I said, it could be that in this situation clinical thresholds are around here, we are worried, but down here that we're not so worried. So the model could still be clinically useful even though this calibration is not perfect. So it's an example of where a statistician may fall short and say, well, this is not calibrated, don't use the model. But actually clinically it may still have some value. It's so important to have this communication between the healthcare professionals and the statisticians in terms of application to understand whether it's useful. And clinical impact can also be evaluated beyond the development and validation of a model. So for example, we can do health economic modeling to simulate participants on particular pathways based on model predictions, and we assign treatment decisions based on those pathways. Ways and then work out if it's cost effective. We could do a randomized trial, ideally maybe a cluster trial where we have some clusters randomized to using the prediction model, other clusters to usual care. On average, do the clusters with using the prediction model, do they do better in terms of some outcome? We can also look at decision analysis and evaluation of something called net benefit, which is a measure of clinical utility. This is a very complicated measure. This— not going to go into details too much, but basically what you're doing here is weighing the benefits against the harms. So you know that, for example, if you have a risk threshold of 10%, that you need to treat— if that's your threshold, then basically you're going to treat about 10 individuals so that 1 benefits. And that threshold is something that needs to be decided on by clinicians and healthcare professionals, what's the benefit to harm ratio that you're willing to use? You know, if you think about biopsy, how many biopsies you're willing to make to identify one that's genuinely got cancer and the others that don't? And there's side effects to think about. You know, these are proper clinical decisions, but the impact— what the threshold is— and then that threshold can lead to you looking at the calibration point. How would you understand whether there seems to be benefit for that model at that threshold. Net benefit here is shown on this particular graph. We've got net benefit against the threshold probability, and we've got a strategy here on the bottom which is never do anything, don't treat anybody. We've got a strategy here that we always treat, and then this is from using the model Based at a particular threshold value. So for example, 0.2— anyone with a prediction above 0.2 would be treated. I'm using that loosely here. We can see that the net benefit for this modeling strategy is higher than the other strategies, suggesting it has clinical utility over and above those other strategies. Very hard measure to interpret, but that's generally what it's doing. If we go back to the Gupta model, then we see that for the Gupta model, which we said was a good COVID model, one of the better ones, therefore C model here, this is their net benefits, and these are the net benefits from all the other models across different potential thresholds, and it's doing better than those other models in terms of utility. So that's when you're trying to translate the model at a particular threshold to say, okay, anyone Above here we will treat or do something different, monitor or intervene in some way. And if we, if we're happy with that threshold represents our ratio of harms to benefits that we're willing to accept, then this is— Okay, so this Final 15 minutes or so, I want to move on to some work that is more personally focused on what we've been doing in the last few years, which is on trying to think about how we can produce more stable models. So a model is more likely to be stable when you've got large sample sizes used to develop it, that you're not overfitting in terms the number of predictors relative to the number of events you've got. Then you try and use methods to adjust for overfitting, like LASSO, machine learning methods like ensemble methods which aggregate across predictions. And we use statistical methods like cross-validation or bootstrapping to examine and adjust for optimism. You can expose issues of model instability by using bootstrapping, where you repeat the model development process multiple times and then see how your predictions change depending on the bootstrap sample. And clearly, if there's instability, then the models will change a lot. You might be quite surprised and shocked by some of the things I'm about to show you. So the question is, is your model stable? Most models are like this, where people just throw everything at it. particularly with machine learning approaches, um, you know, they might have thousands and thousands of predictors and 20 events or 100 events. Let's just throw everything at it and let's just see what happens and who can get the highest z-statistic, and let's have a competition. It leads to a situation where things are highly dangerous and about to, about to go wrong. So instability is the idea that the model that you develop, for example, that regression equation, may be very different if it were developed again in exactly the same way, but you just happen to use a different dataset of the same size from the same population. So think about the idea that you develop a model in a particular dataset. What would have happened if you just sampled a different dataset? Dataset of the same size and then develops it in that. If it was stable, the model, you need to set the same result. If it's not stable, you're going to get maybe different intercepts, different included predictors, or different trees, different estimates of predictor effects. In that situation, the concern is that If I use the prediction on me for one model, I might get a prediction of 0.2, but if I'd used a different model, I would get another prediction that's vastly different, like 0.7. So we shouldn't be advocating models that are unstable because at the individual level, we are making decisions at the individual level, and if one model is telling you this and another model is telling you that, then what on earth is going on? This is not, again, a sensible situation for making predictions. So the larger the instability, the greater the threat a model is unreliable. Basically what that means is that we're worried that the model does not have internal validity, that if you were to apply that one model that you happen to develop in the population in which you developed it from, that it's unlikely to actually perform well. So what we're suggesting in some recent work, which is in press in Biometrical Journal, is people should always report the instability assessments after developing a model so that we can see what this threat is likely to be. Now, there are many other papers on this topic. So Frank Harrell, who's, you know, one of the leaders in this prediction model field, he often talks about how One model is just an example model. Many people have shown how in small samples the set of predictors that you choose is highly unstable. As always, if you go back far enough, Doug Altman already did all this in 1989. He assessed instability of individual predictions in a Cox model and showed that the variability in individuals' predictions is often very, very wide. And he suggested bootstrapping to reveal this, and this is what we've extended essentially in this biometric paper. So this is the process that we suggest. Okay, so we're going to use bootstrapping with replacement. So bootstrapping is where we take a resample of our original data with replacement, so we could, we could sample the same person multiple times, and then we stop when we get the same sample size as the original And I'm going to suggest to do that, let's say, 1,000 times. We get 1,000 bootstrap datasets of the same size as my original model development dataset. And then in each bootstrap sample, I'm going to say to use exactly the same methods that you used to develop the original model to develop a new bootstrap model. So I'm going to get 1,000 bootstrap models. I'm then going to suggest to apply each of those 1,000 bootstrap models back in my original dataset and calculate the predictions from each of those bootstrap models for every individual in that original dataset. So I've now got 1,000 different predicted values, one for each of the bootstrap models for every single patient in my original dataset. And then I can plot what's called a prediction instability plot. What is the variability of predictions at the individual level across all those bootstrap And I can say what the variability is in reference to the original model's predictions for those— for that individual. I could also look at other measures like how unstable is the calibration plots. So that calibration curve, how does that vary? How does the C-statistic vary? I can also work out the average difference between the original and the bootstrap model prediction. Let's look at an example. So I'm going to develop a prediction model for risk of death by 30 days after an acute myocardial infarction. I'm going to use a dataset called the GUSTO-1 dataset, which is freely available. It's massive, got 40,000 participants, 3,000 deaths. Overall risk is about 7%, and I'm only going to use 8 predictors which are known to be diagnostic in the field listed here. I'm going to use a LASSO logistic regression model. So that's a logistic regression that's using a LASSO penalty to account for any overfitting that might occur, which in this big dataset shouldn't be anything. Just for reference, the model in the full dataset gives a C-statistic of about 0.8. But let's have a look at instability. So let's look using the bootstrap method to look at This is the full data, and on the x-axis, this is my prediction from the original model that I developed, and on the left is the prediction from the bootstrap model. So for example, here I've got an individual who had a predicted risk of 0.4 from the original model And across all the bootstrap models, the range is from about, what, to about 0.5 down to about 0.35. The 95% interval of values is much narrower, from about 0.37 to about 0.43. So that dotted line gives me a 95% variability range of predicted values Around the original individual's values. Very, very tight, as you'd expect. This model is very stable. If I happen to create another model in a different dataset, then the predictions for every individual will be very similar to what this is. This is an ideal situation. If I rather develop the model in 500 patients, 35 events, so about 4 events per data, you now start to see this instability. So let's go back to that predicted risk of 0.4. Now we see that a 95% range goes from about 0.15 to about 0.65. So I'm going down to about 0.15, low risk perhaps, to 0.65, very high risk. Now this is not stable. The decisions could well change depending on whether this individual is low risk or high risk. Obviously it depends again on the clinical setting, but you can clearly see that you'd be worried that this model doesn't work well in practice, whereas in this one you think it should work well. This is just based on development data, but you're exposing something that's never revealed if you just present the model equation. The C-statistic in this example ranges from 0.77 to 0.83. That's quite stable. So on some scales, it's— the instability is hidden, but on the prediction individual level, there's clearly starting to be some concern. What about calibration instability? This is the calibration curves plotted back in the original data. You can see again they're very narrow, not much spread about the curves. This is in the small dataset. Big, big calibration uncertainty. So if I was to apply this one model that I happened to develop back in the original population, it could be that it's very, very badly calibrated. But some people would argue with me, hang on, don't modern methods address this? We know that AI solves everything. So come on, we know that these methods surely must make an improvement over your old-fashioned statistical methods. And many of these modern machine learning methods do try and reduce instability. So for example, they develop a lot of ensemble methods, which are basically aggregating many, many different models, averaging predictions over To try and reduce instability. Some of them are called super learners. Good premise of them, sometimes, you know, sometimes are very good. Random forest is one really popular method where it uses actually bootstrap aggregating to generate predictions over multiple models. So it's sort of doing what I'm doing, generating multiple models and averaging everything.
So it's like a random forest, but it's not random.
It also uses a random element to feature selection to try and reduce correlation across models so that when you average across them, it's averaging more diverse things, which should help. How does it perform? So this is how it performs. On the left is what I've already shown you, the small sample size situation for the LASSO, which I said was worrying. But then clearly, see, for the random forest— now these methods are supposed to be better than statistical methods. Or that's what the hype would say. You speak to people that really know, they know there are limits. But what's going on here? Somebody with a prediction of 0.6, actually their prediction could in truth be between 0 and 1.
What?
Yeah, it's not great. A little bit cheeky because here I've just used the default settings in Stata with 100 trees. If you were more refined and actually be more sensible in how many trees and branches you fit, you can get back to something a bit more like this and just get the structure. But many people of course wouldn't know that and would just fit default settings. Clearly these machine learning methods can have more instability, um, and yeah, we need to expose this. And actually it's not really the debate, is it, whether machine learning and statistical methods are better It's about really choosing and identifying the right method to develop the model in your setting, given your particular sample size and situation. Machine learning methods could have a lot of potential to identify complicated relationships, but they often require a much larger sample size. And I think for healthcare, the black box element is concerning to me because as a patient, I would want to know know what the model is and whether it's reliable. I'd want independent people to validate it. And if it's black box and only available on one server at the host institution, I'd be worried that that is not transparent and, you know, independent. There's also a drive for explainable AI and fairness. Well, how can you check explainable AI and fairness? In an unstable situation, you can't. So we need to be realistic. Last, last 5 minutes. A note on sample size. Clearly instability is dependent on the sample size. A larger sample size, you're going to have a more stable model. So there needs to be more consideration of sample size calculations when you're doing prediction modeling. We proposed 3 key criteria to check. Can you estimate the overall risk precisely? If you can't estimate the overall risk precisely, how can you estimate individual risk precisely? Try and target a small mean absolute prediction error and try and target a small amount of overfitting, so maybe shrinkage less than 10% in some sense. We developed a package called PMSumpSize that's freely available in R and Stata. This is really derived based on regression approaches, but it is still relevant for machine learning because, like I said, it provides the minimum, and likely that machine learning needs even more than regression. Here's an example of PM sample size in action. Like for any sample size calculation, you have to put in some input. So here I'm putting in a conservative estimate of my R-squared performance, 0.2, how many parameters I'm thinking of putting in the model, and the prevalence of the outcome, proportion of the outcome. Plug in these— I haven't got time to go into what's going on behind the scenes, but it's minimizing those criteria. And here we see that this particular criteria, we need about 1,200 patients and about 600 events, so an events per predictor parameter of about 20. If I was to assume a higher R-squared, so maybe the literature before it all already said that R-squared would be about 50%, then I would— that means that I'm explaining more variability, so there's less overfitting, and EPP would be about 10 in that situation. So that's just a brief example. Notice though, it doesn't mean necessarily that you're going to get stable results. This is the minimum, so this is the bare minimum. Even in the bare minimum situation, going back to that example, 700 participants, but some predictors back in that original example, there's still quite a lot of instability at the individual level and some instability in the calibration plot. So you still need to look at instability even if you've done a sample size calculation, and there's always going to be instability in some sense. How much does it matter at the individual level? I think that's unresolved. We can talk about that, but certainly, you know, unless you've got data that's huge, there's always going to be some individual Variability. But you do want to try and minimize it to some extent. And then lastly, for validation, if you're doing a validation study to check the performance of a model, you also need to make sure that that is large enough to precisely estimate model performance. So can we estimate calibration curves precisely? Can we estimate discrimination and clinical utility precisely? So again, we've just released, I'm really pleased to say, PMVal sample size. This is using criteria to identify the target confidence interval widths, and you have to enter what you think the model's predictor distribution will be, the outcome proportion, again what you think the calibration performance is going to be. Again, we suggest starting from assuming that the model is well calibrated. and how, you know, whether you've got the sample size large enough to actually find that it's worth going with. So that's the exciting that's just come out in Stata, not in R just yet, but not far off. So here's an example. If we were looking to validate a prediction model for deep vein thrombosis, we knew from the model development study that the linear predictor, the whole predictions have this on the logit scale, have this distribution, and we assume that that's the same in our validation sample and that the model is well calibrated and that the outcome proportion is 0.2, then we'd need a sample size of 400 to estimate the C-statistic precisely defined on this width of the confidence interval, about 2,500 for calibration slope precisely, and about 1,300 for the error of the E precisely. These are subjective, but clearly calibration is driving this. So it's so important to get calibration right, but it does take a larger sample size to be able to check that. We can plot calibration curves of particular sample sizes from the package to see what the variability will look like. Like I said, it's quite hard— is the calibration slope in Is 0.2 precise? Quite a subjective thing. So actually simulate what the calibration curves would look like based on this sample size or a lower sample size, and then you'd have to judge yourself whether, you know, is that okay in terms of the variability that I could get, or is this something that you're striving for? So in summary, we are— the prediction model community I'm talking about— is a very diverse set of researchers nowadays. We identify in different ways. Some identify as machine learners, health analytics in the NHS, maybe AI researchers. This is stereotyping, but it's statistics. I've not done this, I've taken this from Twitter, but it illustrates this point that we've all got different backgrounds, we all identify in different ways. But I think regardless of where we identify And including statisticians, the standards in prediction modeling research are very, very poor, very poor. And we need to come together and educate better and train others better and enforce higher standards and aim for stable models, because like I said, individuals' healthcare decisions being made on these models. So let's make sure they're stable. Let's check that they're well calibrated. Let's make sure they're validated and examined for their clinical utility and impact. And all these things, I think, require us to also think about standards. Just finish with some self-indulgent references and also to make you aware there's a website which you may not know called prognosisresearch.com. which we've set up to try and give an entry-level introduction to the field. So for example, PhD students or new researchers who are starting to work in prediction modeling and prognosis research, to say, look, these are the basics, at least to try and have that. And also we do run some short courses at Birmingham if you're interested in prediction modeling and IPD measurements. But I'll stop there. Thank you very much for listening. Thank you.
So it looks like we've got some questions already, is that right?
Oh, on the chat.
On the chat, yes. Okay, so do you want to read them out?
Yes, so, so Blacksmith asks Do you want to ask it in person, or shall I just read it out? Can we use CHARMS checklist whilst extracting data from original studies for both machine learning and statistical models? Yes, you can. So the CHARMS checklist is a tool for telling us what to extract from published studies when we're doing systematic reviews of prediction models. So the information that we'd want to extract should be very similar for those models. How do different machine learning models like random forests correct overfitting?
Well, who knows?
They— because they average across multiple bootstrap models, they hope that that addresses overfitting. So it's a bit like regression to the mean where, you know, you have one model that estimates a high risk, another estimates a low risk. On average, you just hope to get back to the— closer to the right answer more than if you just had one particular model. Part of the issues with random forest models, they're not well calibrated, and that's why they try and do that. And the last one on here, many machine learning models report their performance in terms of accuracy and Breer score rather than calibration discrimination. What is your opinion on these measures? Awful measures. The machine learning community, in my opinion, are getting it badly wrong in terms of performance measures. So like accuracy, what does that mean? Sensitivity and specificity, again, that's based on thresholds which, you know, we should be looking at clinical utility, not those. Calibration is important. They don't check those. Yes, I think they are getting it wrong.
Right, there's another message online— sorry, question online, but I think we'll come into the room. Beatrice had her hand up first.
Yeah, so I was in a situation where we, we did the calibration plot for a model and I went into a meeting with the clinicians, and it didn't look quite right towards the the high observed risk. So they asked, "Can we get rid of some observations that are outliers?" So the collaboration did you have exactly?
Yeah.
It made me wonder. You didn't mention publication bias in this field, but it made me wonder because for them the worry was. will we get published if it doesn't look quite right? And so what's your take on that? Do you think people are either on purpose ignoring these graphs because they know they don't look the best, or just submitting things that are just looking really good and that's why they get accepted? So what do you think is happening?
It's a bit of both. So there's There's a lack of understanding about calibration, so they're not by default something that they would go to compared to sensitivity and specificity in those measures. So there's that. But then there's also definitely people that look at it and then don't report it. I've been exactly— this is a really good example actually. For a model like this, I have been told explicitly by the clinical lead, take off the the blue curve and just report the green dots because they don't— they say the reader, their eye will be drawn to this, therefore they will say it's miscalibrated. But if you take away the blue curve, they will focus on these down here and this one, and so actually it's pretty, pretty good. And so you have this battle to say, no, this is, this is the actual true picture, and And I've also had that with BMJ reviews. For example, with the COVID model, they had— they didn't want to present this fully. They wanted to present the groupings, and I was constantly asking for the curves.
So do you think there is value in publishing models that are not as good in terms of, for example, their calibration, so people actually know This needs to be improved.
Yes, exactly.
I suppose you also, in that case, you said that actually if this is the group that you're most interested in, then that's going to be good enough. But actually, if you come out of that, those assumptions just don't hold, and, you know, you're gonna have to do something different. Yeah. And I think that has to go in that discussion.
It has to go in the discussion. Yeah, yeah, yeah.
At the back there, go for it.
Hi.
I just want to ask one question about the PN sample size, because I'm using the PN sample size to calculate the sample size. But because I'm using survival analysis, and in the PN sample size in the survival analysis, you need to set the time points, how long the prediction model will be. But for example, my dataset is Parkinson's disease, so my prediction time would be like over 10 years. And then if I put that thing in and the result coming out will be ridiculous high because if the population will be like 5,000 and then you need to have so many events which we definitely do not have for the whole world. There's no one dataset looks like that. My question is, is the PN sample size reasonable for all the disease? Like, for example, Parkinson's disease, the follow-up time is so long. So, if you put that thing in, the coming out is like that and all the model will be at risk of bias.
Well, it should be. It is based on mathematical formula for minimizing overfitting, so it should be right. What I think you might be experiencing there is perhaps a rare outcome.
Yes.
So clearly, in situations with rare outcomes, you're going to need a lot of individuals To see enough events. It also depends on how many predictor parameters you're putting in.
It's 8.
8? Yeah, yeah, so not a lot. It will be the rarity of the outcome. Maybe in situations like this we have to think about whether we can utilize in some way other information from external sources. For example, in a Bayesian approach, you could bring in prior information about predictor Case-control study designs maybe could be embedded in a, like, a case cohort study or something to be a bit different than a simple cohort study where you're recruiting thousands and thousands and thousands of people just to see 40 events or something. I don't know the answer to that, but I do know that if you were to develop your model in that sample size, with those predictors, with that R-squared, that you would get that small amount of overfitting. Sadly— well, it's a good thing that the events are rare, isn't it?
But yeah, because it's like 10 years, like those events coming out later, like much later, maybe 7 years, 8 years later. Like, I have patience, but my prediction time is very long. That's the problem.
Yeah, with longer times, you'd expect more outcomes. Than if it was like 1 year or 2 years.
Unless the event always happens fairly early on.
Yeah, it also depends on the censoring rate. So how long people have— I mean, they're only followed up for 18 months or something, and still, you know, you're not helping.
A couple of questions come in online, so I'll ask those. So Angus, you got your hand up. Do you want to, uh, ask your question?
Yeah, thanks, Richard, for a great talk. Um, I was interested in what you had about instability plots. Is it possible to do instability plots with survival analysis? Yes, it is. Um, so we do exactly the same approach. So your survival models, as long as you've got Some estimate of the baseline hazard or the baseline survival, and we can make predictions from those as well. If people are fitting Cox models, then they don't naturally give you predictions, do they? Because you don't have the baseline hazard. But if you've got the baseline hazard, then you can do this, the predictions. But it's always at a specific time point. So actually, you could do multiple instability plots, you know, if you do want to check the instability at 1 year, at 5 years, at 10 years. It could change. So yes, but probably multiple plots. Does that make sense? Thanks very much. That's great.
Sam, okay, so thanks for the interesting talk, Richard. I'm a medic, not a statistician. Did my master's thesis on prediction modeling. Sorry, just trying to see more. In your MI example, you use penalized regression. Despite large sample size, would you recommend always using penalized regression? Are there any disadvantages?
Thanks. Yes, in a large sample, what you'd see is that the penalized bit of that regression doesn't have any impact. So what the penalization means is there's a penalty term added to the likelihood, so the regression equation, so that the betas the predictor effects get pulled down towards the null value of 0. But with large data, that shrinkage, that pull is tiny. So it really has a bigger impact in datasets that are smaller. It doesn't— it does better than not using penalization because otherwise you get overfitting, but the Penalization methods themselves also lead to instability by the fact that, um, by random noise, meaning that in a random dataset they would penalize one predictor a lot and another not by much. But then if you had another random dataset, it would penalize a different predictor more, maybe get rid of another one that wasn't predicted, uh, discounted in that previous model. So it actually— the penalization approach, which is a measure of, uh, which is part of variable selection, can itself lead to overfitting. There's an argument, and Frank Harrell uses this argument sometimes, is that you should pre-specify your model, just include all the predictors regardless, and then that leads to less overfitting and less instability because you've got no variable selection in there at all. Does that help a bit?
Not sure.
Sam, do you want to come back on that?
Yeah, he says thank you.
Yeah, good. I've got Alison first and then—
Yeah, so my question is actually completely different because I'm a clinician and actually I come across papers all the time about risk prediction, particularly as I work in laboratory medicine, and I mean I don't see the value because almost never do these ever get used in clinical practice anyway. You know, it's just like somebody's collected a bunch of data and they just want to do this so they can write something up. But the risk prediction model that people do use— well, there are 2 in Scotland, one which we're supposed to use and the other one that we actually use. So the one we're supposed to use is the ASIGN cardiovascular risk score, which in their wisdom, SIGN decided to use in preference to QRisk. And I've always used QRisk, but I really value any information you have about how good you think QRisk is. Has it overcome some of the multiple problems you talked about in developing good risk prediction models?
Yeah, um, let me put that back on. I think QRisk is very good, actually. Yeah, I think they have shown that it's well calibrated, that it performs well in different regions, in, um, when they've broken it down to check performance in different, um, regions and locations. So actually it's one of the very best, I think. Yeah, and of course the way it's used, I think, really is to try and improve population health. So even though it's an individual decision tool, really what they want to see is that, you know, there's less people having CVDs by 10 years. So whether the individual should or shouldn't be getting statin, as long as on average there's some sort of benefit, so for the population. I think that's really their focus. So they might argue that this doesn't matter, individual instability. I think I'm trying to come at it more from a patient point of view, that you want to know you're getting it right. But clearly there's always going to be this trade-off. So it is one of the better models. QRisk-3, I think, is a bit more contentious because they've got some extended variables in there like standard deviation of blood pressure I think that stops it being used as much because I think people don't know what that means. How many measurements do you need for standard deviation of blood pressure?
So it wouldn't be something that you'd be able to fetch off routine databases at all.
No. So QRIS-2, I think, is very good, and QRIS-3 I'm not so sure about.
But, um, there's also QRIS for fracture prediction as well.
What was your second one?
Sorry?
You said 2, you mentioned there's 2, which one we use in practice? Was it QRISK you use in practice?
Yeah, the other one is ASIGN.
Oh, ASIGN, yes.
I'm actually hearing you say that, I wonder about QRISK too and whether it's actually been validated in the Scottish population.
Oh, there you go.
Yeah, we're supposed to use the ASIGN risk scoring, which doesn't have as many variables, but it has deprivation in it.
Yeah, when you say suppose, is it because NICE recommended it, or supposed to because it's in a guideline, or why?
Yeah, and look, SIGN guidelines in Scotland, the SIGN guidelines, you should use a SIGN rather than this. Sophie?
So I was just thinking about those COVID, the COVID thing you were looking at before, and that there's clearly some issues in the field when it comes to people making these models. And then you also said something about replicate and validate, and that made me think of psychology where they've just had a huge replication crisis the last decade. Is that coming for your field too, do you think?
Uh, yeah, I think it's coming for everything.
Or maybe it's not relevant actually because Alison says she doesn't actually use it. So maybe it's just like we're doing this in our own rooms and we're not actually—
You know, this is wrong, but this is very Medical research, everywhere we should be seeing replication to some extent. It's particularly a concern in prediction modeling because the amount of data dredging and overfitting and noise that people are modeling, where we know that that then leads to things that are less likely to be replicable.
Replicable.
So it's, it's, it's already here for this. It doesn't stop people developing models. Most people are not interested in it getting used, they're actually interested in receiving publications.
So is anyone actually checking the replication validity of these models, kind of as they did in psychology? They had a whole big group of psychologists— bless you— that went through this all.
This is what the system must Yeah, for that one therapeutic area.
Yeah.
Okay, I'm really mindful of time. Is there any last questions online?
No.
No, doesn't look like it. Okay, so I think actually in the room we've enjoyed a lovely apple pie, so that's what you're missing, guys. So, you know, do come along and join us if you can. It's lovely to see people in the flesh, isn't it? David, you have one more question.
If you've got time, I've just got a quick question. I really like your clinical— sorry, the instability plots are great. I was going to ask, in your paper, are you going to recommend that we try out different methods using these plots to find which one's more stable and then use that? I think it could be used for that purpose.
Okay.
A little bit hesitant in recommending that because then that leads to data dredging. Yeah, so that the more you look at your data to make decisions about modeling, the more likely you are that the model that you choose is just a lucky winner. Um, but I'd rather that than do a method and then not show us the stability plot. I'd rather if somebody said, well, out of all these, this was the most stable, therefore it is more likely to do it well.
Okay, so playground indeed. Okay, so I'd like to just show our appreciation, and it's been a delight to have you here all day. And if we can just say thanks ever so much.
Thank you.
More from Richard

A general sample size framework for clinical prediction models | Prof. Richard Riley


The importance of sample size for clinical prediction models - NIHR RSS Research Methods Academy

Sample size calculations for external validation of a clinical prediction model

Stability of Clinical Prediction Models Developed Using Statistical or Machine Learning Approaches

Sample size calculations for clinical prediction model research (aka "goodbye rules of thumb")
