The Tips And Tricks To Great Sats Preparation
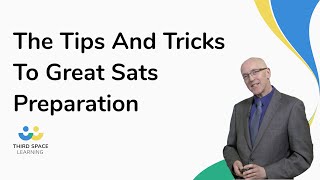
Sam Adams (former primary teacher, maths subject leader, now consultant) gives a practical, teacher-facing guide to Year 6 SATs preparation focused on reducing anxiety and improving classroom routines. Key recommendations: share timings and pacing (about two minutes per question), develop spoken reasoning using the word 'because', use the TECH model (Think, Talk, Estimate, Calculate, Check), deploy memory aids (dingbats, visual cues), teach percentages via the '1% method', use hands-on resources (Jammy Dodgers) for fractions, practise interpreting graphs by generating and swapping questions, and emphasise simple exam technique (use a ruler, write on the paper). The talk closes with a pointer to content-domain coverage and Third Space support.
Chapters
Hello, my name is Sam Adams and today I'm going to be talking to you about this, the tips and tricks to great SATS prep. Just a little bit about myself before we actually go into that. I was a primary school teacher. I worked from foundation stage right the way through to year six. So I do have some SATS experience and quite recent SATS experience too. I was also a maths subject leader. So again, have a good understanding of how mathematics works across the school and working with staff and children. And now I work as a consultant, I work with teachers, I plan with them and I teach with them and also write materials. So let's start right at the beginning. And I think that's quite a good piece of advice from Hitchhiker's Guide to the Galaxy. Arthur Dent, whose house has just been demolished for a highway in outer space, he's handed that book and it says, don't panic. He says it's the most reassuring thing that he's seen on that day. And I think that's the thing about SATs. We just need to make sure that we're not over panicking. The children are ready and secure and the staff are ready and secure as well. So let's get into the actual tips and tricks themselves. I have spoken to children who have said that a four page question is quite a scary question, but actually that's the first question in one of the SATS papers from last year. When you look at it, it's actually not too bad at all. The thing that puts children off is there's a lot of it. So what we need to ensure children do is that they take a breath, they have a look, they read exactly what the question's asking them to do and almost put it into their own minds, into their own words, so they know exactly what that question's expecting. And we'll come back to that in a little while. The second thing is, we know from SATS papers in the past that children have struggled to finish. So if we can get into some sort of routine, some sort of rhythm, so the children know that halfway through the time is halfway through the paper. That makes sense. On average, you have about 20 odd questions on an average SATS paper. That means we're looking roughly at about two minutes per question. If children know that, it means they can work to that level. One suggestion in the classroom would be that we make sure that we share timings with children. We could put that on our whiteboard, our interactive whiteboard, so children know if they're working on a problem or A question, they know they've got three or four minutes to work on that question and we keep to that time limit. Generally, if we can say it, we've got a better chance of writing it and understanding it. So one of the big things that I'm pushing with schools at the moment is this opportunity to speak and listen, because that's going to push reasoning. Reasoning is a major element of the SATs, and it's two papers out of three. Are children secure in what they're doing? Can they explain what they're doing? Can they use full sentences to explain their thinking? The word because is key for me. I'd like to see the children actually make a statement and use the word because and explain what they're thinking and why they're thinking it, to scaffold responses as well. What does a good one look like? A waggle. You may be familiar with the word waggle. A waggle is what a good one looks like. We could actually share that with children and put that up on a wall and talk it through. Or on your interactive whiteboard, we could get children to change a non waggle into a waggle. What makes this not answer the question and how would you turn it into answering the question and focus on vocabulary? Maths has its own vocabulary and terminology has a language, if you like. The more we practice it, as with any other language, the better prepared we are to understand the sorts of things that the sats are going to throw at us. The sorts of terminology, usually in bold writing, that we're clear about. The tech model. The tech model stands for think, Talk, estimate, calculate and check. We found this works really well working in year six classrooms, usually in a problem solving lesson. What has happened in the past is that a question has been provided, the children work through that as a model and then they start to work individually. Maybe seven or eight questions in a space of time. The idea of the new curriculum is to slow things down, and that's difficult if you're a year six teacher, because, you know the SATs are looming on that may horizon. So what we need to do is suggesting that we work together as a partnership. A partnership working with a problem and that problem goes right in the centre. The children talk about the problem, they put the problem into their own words, they use estimation, they make a good estimate. And one thing you can do is give them a false estimate. Give them an estimate that's way out and just see how they respond. For instance, if I said to children, 4,500 at 6,200 is 8,000 and give them a nod. It's amazing to see how many children actually nod back at you without actually thinking whether that's a good estimate or not. So that nod goes like that, and hopefully one or two of the children will look at you and go, that doesn't sound quite right. And that's where your mathematical sentences comes in. That's where your speaking, listening comes in. Why do you think that's not a good estimate? What could I do to make it better? What could I do to the two numbers to make them more usable? Then we can calculate, and then we can check. The way this works really well for year six is if they're working in a partnership, particularly in this section, the Think Talk section, we get the children to write down their thinking. If we write down their thinking and autograph it with their initials or their name, we can see not only what they're thinking, but it gives us a baseline, it gives us a good indicator of how the children are performing. If this kind of approach was used quite early, it just means that the children. Children get it. We can then start to speed that process up. So one problem in a lesson for me is not an issue if that's autumn term. And then we can start to accelerate. It does work. The other aspect is your classroom environment and its ways of getting children to remember some of these difficult words that they might struggle with. And dingbats. Dingbats is a game. It's a party game. And a party game where you take a word and you put an image in it. And that image then helps you to work out exactly what that word is all about. These things about here. So we have acute angle. So the A of the angle. Acute. Children can then put that into their mind. They have a picture when they're in the sat. I know what an acute angle is. I can see it. I can see it on the wall. Parallel lines. Parallel lines never meet. So the two Ls in parallel never meet. And just to annoy the English department, perpendicular, to put a capital letter in for the L, because perpendicular is lines meeting at 90 degrees. So that's one aspect. Roman numerals. For Roman numerals, we could do something like this. The l in the 50 we could highlight in blue so the children get that image of the 50 with the L in the blue in 100. 100 is C. So you could see the C in the two zeros here. And obviously in five, if you wrote the word five, you would have the V in five, which is Roman numerals. Five. Anything like that is going to help the children. It's going to help to stick in their mind. Percentages. There are certain things that have come out from the sats feedback that we know have caused children problems. One of them is percentages. Percentages actually is fairly straightforward if the children know how to use their fluency. Fluency is major at the moment. It's a big, big thing. We want children to be fluent, we want them to solve problems and we want them to be confident and to show their reasoning. If we look at this example here, we've got 360 is the whole thing 100%. And we could say to children, if 360 is the whole thing, we what else do we know? And then we can start to make connections. So half of that total is 50%. So if I halve one total, I halve the other. If I then halve that, I've got 90, which is a quarter of the original, which is 25%. If I add the two together, I get 75%. And again, this is where working in schools is quite useful, because children sometimes don't realise you can add, subtract, multiply and divide percentages to get other percentages away. To the right, 36 equals 10%. All we've done there is divide it by 10 and then we've got 1%, the magic 1%. Because in stats questions, it tends to be find 41% of this or 49% of that, and children look at that question and go, I can't do that. That's impossible. But not if you can find 1%. Because basically 49% is 50%. Take away 1%. And once children know that, it's dead easy. In one school, we asked children to go home and teach somebody at home how to use this method. And so we had aunties, uncles, granddads, etc. Understanding how percentages works, possibly for the first time. Jammie Dodgers always a bonus if you've got Jammie Dodgers. Jammie Dodgers come in packs of four. They're quarters. So when working with year six children struggling with improper fractions, improper fractions and mixed numbers are very, very difficult for children to get their head around. You can have five quarters, how can you have five quarters? I've not seen that before. So if we put a number line together and we actually, with the children, start to take the Jammie Dodgers out of the packs, the children can see that one Jammie Dodger is one out of the four. If it's one out of the four, that's one Quarter, it means they've got three quarters left in the pack. You take a second Jammy Dodger out, you put it on your number line. We now have half or two quarters. And the children can see there's half out of the pack and half in the pack. Keep going. Three quarters. That link, that fluency link of understanding that that measure is the same as that measure, it's the same as that measure, it's the same as that measure helps the children to understand that three lots of that is three quarters. And we take the fourth one out of the bag. We now have four quarters, which, again, is quite a hard concept for some children to get their head around. But four quarters is the whole thing. And we put the wrapper on the top of the number line, so we've created an edible number line. Now, you can do this with lots of different things. There are various products that come in fifths, come in tenths, halves, quarters, etc. It's a great couple of lessons to get the children to really understand exactly how this thing works. And. And then they start to make connections. They start to say, well, that's equivalent to one, that's equivalent to a half. They then take a second pack and once they take that second pack out, they now have five quarters. And now they see they've got one whole and one quarter, they then understand that's the equivalent of one and a quarter. So when we have these sorts of questions in the sas, the children are sitting there going, I'm not sure the visual image, hopefully in their head, will be Jammy Dodgers or equivalent statistics. Statistics, I think, are fairly straightforward. Again, thinking back to problem solving, generally, children are given a problem to solve. They work individually and they might just work through seven or eight in a lesson. Why don't we flip that on its head? Why don't we not give them a question at all and just give them a graph or a chart and say, tell me all you can about that graph and that chart. Does it have a title? Does it have a scale? What's the scale going up in? What's the scale on the bottom going up in? What's the difference between the two scales? Why is that labelled like that? What can you tell me about that graph? Why is it a line graph? Why not a bar chart or why not a Venn diagram? Why is the line graph ideal for this question? And we get the children, as we did before, to write their thoughts around the outside. You could then extend that by getting groups to write questions based on their statements, swap papers over and then get children to mark other children's responses to their own questions, which takes it on a level. Rather than saying, here's a graph, here's a question, answer the question about this graph, okay? And finally, it's really important for the children in the SATs that they do follow instructions and follow them carefully. If it says use a ruler, use it, please, Please use it. We have a number of cases where children have tried to draw straight lines freehand. It's so frustrating. Those are easy marks. Draw an amount to a certain amount of millimeters, easy marks if you know what you're doing and you use the ruler properly. And a sharp pencil, of course, rather than a barge pole of some sort. Please do draw and write on the paper. A SATS paper is an official paper, but you'll need to understand there's lots of space on it. Just going back to the graph question, fill it in. If you've got gaps there and you're not sure what those gaps are, write on it. When you're reading the graph off, actually take a ruler look at 3pm, go up to where the mark is and then mark it across. Draw on it, write on it. It's fine. You won't get penalised for doing that. It's absolutely fine. And children need to understand that's okay. Even though it's an official document. And finally, finally, it was missing in 2017, so does that mean it could be in 2018? A useful reference is the contents domain coverage. The contents domain coverage gives you a good idea of what's been covered, which area it's come from and which year group it's come from. So you'll be able to see what has been covered this time, but also where the gaps are. For instance, in 2017, there was nothing on nets for shapes. Does that mean we might see that in 2018? And finally, finally, finally, with third space, please do speak to us. Find out more about our effective ways of supporting year six in the run up to the SATs, and you have our contact details there. I hope that's been useful. Thank you very much for listening.
More from Rob


The Top 20 SATs revision topics 2026: A focused revision approach for maximum impact in minimum time
GCSE maths marking 2026 decoded: using examiner insight to improve teaching and results

How To Embed AI Literacy In Your School: Practical Steps To Get You Started [Webinar Replay]
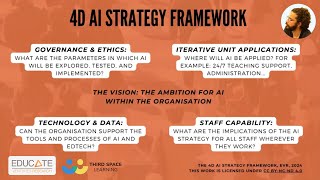

Reviewing And Planning Your School's AI Approach: A Strategic Framework [Webinar Replay]