Mark Danolo shows how to turn sales compensation data into stories that executives actually use. He walks through a medical-tech case where rep-level analytics revealed quota and pay-mix problems, then shares five principles for making analytics actionable instead of just complex.
Chapters
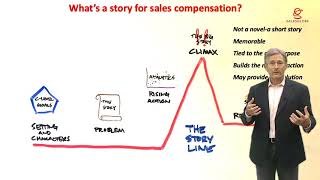
Hey everybody, I'm Mark Danolo with Sales Globe and welcome to our session on creating story based analytics. I'm real excited about this because we're going to get into some cool areas. We're going to talk about what a story is, we're going to talk about the importance of stories and we're going to talk about how to weave sales compensation into a story and how to get people motivated and get action out of it. So it's to going, going to be a really fun session, creative session and I'm excited to be talking with you about some new ideas here at Sales Globe. We're a problem solving firm for sales. What we do is we try to figure out answers to the toughest sales problems. And we love to help clients think differently about things that they've been doing year after year and things they've been stuck in for a long time. We love to write. We've written a couple of books. The most recent is called Design Thinking to Solve youe Biggest Sales Challenge. In fact, today I'm going to refer to a few areas of that book as we go into the story part and you can go deeper and you can look at some sample analytics in that book as well. And then another great book is called what yout CEO Needs to Know About Sales Compensation. That's about connecting the strategy to the front line. And if you put both of those books together, you'll get some great ideas in terms of connecting sales compensation and quotas strategically to the organization. At the Sales Globe studio here, we are always working on writing on stuff. We write on walls, we write on whiteboards. We've got rolling whiteboards everywhere around the, around the studio. And one of the things we're working on right now is this question of what's the post Covid future of sales? What does that look like? And we're looking at some of the big considerations like how's our environment going to change? What are the challenges we're going to face? Is this going to continue on for some period of time? What's the market going to look like and what would sales look like possibly in the future? What are the different iterations or possible permutations of the sales organization in the future given social distancing and all the things that we've been dealing with? So as we talk about this today, I'm going to be pulling up a few ideas in terms of analytics to support understanding some of these possibilities. And we're going to be of course focusing in on sales compensation and, and telling the Story within sales compensation. But I want to pull some pieces from the whiteboard today to share with you as we go along. So this is something we often think about. We need to fix a sales comp plan because the organization is underperforming. That's a problem statement, right? So what do we do with problem statements? We go out and we try to solve that problem statement. The problem with the problem statement is it's like a big immovable object. It goes on the table and we all go after it and we say, okay, what are we going to do? How are we going to fix this thing? We're going to go do some brainstorming sessions, post it note on the wall or virtual post it note nowadays. But the problem is we're not really solving the real problem in a lot of cases and we have to dig further in and we have to understand the story behind that problem. When you understand the story, you can develop this thing called a challenge question. And a question by nature is more provocative than a statement. If you think about a question, what does a question do? It evokes thought, right? It gets you to think about different ideas, different possibilities. So as we're going in talking about this today and we're talking about stories, I want you to think about questions you're asking within the story and questions you're asking about the analytics as well. And with those questions, you're probably going to come up with better answers. So you see a lot of question marks on stuff that we'll be sharing with you today. So analytics. Too often we're approaching analytics. It's like a panel, a panel like a doctor would do a panel of blood tests. We're doing, we're doing the histograms, we're doing the pie charts, we're doing the scattergrams. And we're looking for something within those analytics. We're taking a shotgun approach, looking for a problem. It's almost like we're doctors and we're doing X rays on the entire body and we think we're going to find out something by looking at the entire body instead of perhaps asking questions of the patient and understanding really what's wrong. So we're going to be asking those questions as we do these analytics. Because we don't want to have analytics without a cause. We want to have analytics that are intentional, that help us to try to figure out what's really going on within specific areas. So you don't have to have all analytics in all situations. You can have analytics that are focused in on that specific problem that you're trying to solve for. So stories. Well, we take analytics, we take stories. Why are stories important? We're a story culture. I mean, that's how people communicate in stories. When you think about hearing a story, that's when you engage very often versus just hearing a bunch of information. We learn through stories. So when we were kids, we learned through stories that were told to us. We learned through stories that we read. Knowledge is passed down in stories. We passed down knowledge within organizations, within families. In fact, probably a lot of stuff that you know now you learned through stories in your organization or perhaps other organizations. And I think one of the most powerful reason stories are important is because they engage people. Right? We get into stories because we become part of that story. And that's what we want to do with sales compensation analytics is we want to create a story that's compelling, that people start to engage and they get into. So think about those qualities as we're working on these analytics. So back in March, we ran into. Ran into a problem. We were a few months earlier going out to Phoenix and we're doing some work with World at Work. We flew out there and I was with my partner Michelle, and we visited with Chris and Lindsey. And Chris and Lindsey are on the research team at World at Work. Really smart people. Great, great with the data. And we had a meeting with them and we talked about this sales compensation survey that we're going to do with all the members of World at Work. And we talked about what do people want to learn about what's going on with sales compensation structures, what they're thinking about in the future. And then after the meeting, we went and had lunch at this great sushi restaurant. It's one of those places with the revolving sushi bar. And I think I had like 17 plates of sushi. And I tried to hide some of it behind Chris, but didn't quite work. But great restaurant. That was something I really remembered. And then we went back and started working on the survey. And the problem was that along the way, this thing happened called Covid and it made the survey kind of irrelevant. And we thought, well, what are we going to do now? This is not even information that people are interested in. And fortunately, we hadn't launched it yet. We were thinking about what we were going to put into it. And we took about 48 hours and we figured out the things that were important to people, what they wanted to learn about, what's happening with COVID and sales compensation. And we did a survey on Covid and sales compensation and what companies are doing, what they're thinking about, actions that they're taking or planning on taking. And we came up with a whole bunch of information, a whole bunch of data, and we didn't quite know what to do with the data. We're like, well, there's a whole lot of stuff here and I don't know if anybody's going to be able to even read this or make sense out of it. So we sat back and we said, well, maybe there's a bigger story in this. And so we took this bigger story and we mapped it out pretty simply. COVID 19 has organizations in fast response mode right now. And what's happening is they're trying to figure out what to do in terms of customers. About half of organizations have talked about how to engage with customers and they've communicated to their sales organizations what they should be doing. They've shifted from selling to, to helping. Really important thing now in the time of COVID is to be thinking about what can I do to help my customers? And nearly half plan to minimize the impact on compensation to their sales organizations. In the area of communication, only 15% have communicated anything to the sales organization back in the March timeframe. Now that's changed a lot since then. But almost half have assured the sales team that there's going to be some kind of compensation action. But they're, they're really trading on trust at that point. And so trust is really strong in organizations with less than 1,000 employees and strong as well in larger organizations. But the smaller ones tend to have a little bit more strength in terms of that trust relationship with employees compensation. 36% of organizations have taken action or have some kind of plan in terms of what they're going to do with sales compensation as of that time period. And, and the top things they were considering were quotas and performance measures and thresholds. And the top things they were taking action on were around performance measures and quota adjustments. So what just happened there? Well, that was a story, right? Something happened. There was a lot of data, something changed. We didn't know what to do. And then it kind of melded into a story about the story that we told about the survey. Right. We could have just come out with a whole bunch of information and that would have been kind of interesting. Not as many people would have engaged with it and it wouldn't have been as meaningful. But because we put it into a story, there's kind of a concise message that people can grasp onto. If you want to go get more detail on this. You can go on the World at Work website and you can also go on the Salesglobe website and get the COVID 19 sales comp survey. So pretty good example of a story. And this just kind of happened because we needed it to happen because there was so much going on and, and we had to cut through all the static and make a really clear message to the organizations that were participating. So why stories for sales comp analytics? Well, they simplify the complex. If there's one thing that sales compensation can be is it can get pretty complex, especially within the analytics. They engage the audience. That's something we need to do with the audience with all this complexity is make sure that they know what to hook into, what's really important. They create memorability. So if we do it right, they're going to remember what we're talking about and they're going to take that with them and they build commitment. So when you think about it, aren't these the things you want when you're working on a sales comp fact finding report or recommendations report? Right. You want simplicity, you want engagement, you want people to remember and you want commitment toward that action that you're asking for. So some really good reasons that you would do this. So let's dive a little bit deeper. We had a storyline before the story about world at work and Chris and Lindsey. And it's similar to the classic storyline. And the classic storyline lends itself really well to what we can do with sales compensation. So we have a setting and we have characters. Think in terms of what we call C level goals. We'll get into that in just a minute. And then all of a sudden a problem starts, something happens. Maybe things don't line up with the C level goals like we thought they were going to line up. Right. And so a story happens and we need to investigate, we need to figure out what's going on. And we have this thing called rising action. The analytics happen and the rising action is as we're learning and the tension is building, we're learning more about what's going on and what's going on in that story and what must be done. And then there's the climax, there's the big story that comes out and then we have resolution. Resolution gets into. What are we going to do about the situation directionally, where are we going to go? We call that a solution vision. What's our vision for where we're going to go? So a sales compensation story, it's not a novel. It's a short story, right? So think Edgar Allan Poe. Maybe not quite as ominous and scary, but it's a short story. It's something people can remember, it's memorable, it's tied to the core purpose. When we think about the core purpose, we think of the C level goals, right? What's important to the organization and it builds a need for action. So we want to do something as a result of this story. And as I said before, it might provide a resolution if we take it that far. So from the resolution point, you would carry that into thinking about your horizontal thinking and your divergent thinking and coming up with design options. So keep this storyline idea in your mind as we talk about this and we'll show you how to how to put things together according to a storyline like this. So let's start with this idea of C level goals. So C level goals are basically the things that are important to the organization. And I like that as an anchor point because it shows you, the North Star, shows you what you should be focusing on in terms of what the sales compensation plan should do now. C level goals. We developed this years ago and it was developed because we had worked with a number of CEOs, a number of presidents, and there was one fellow in particular, his name was Bob. And Bob was notorious about tearing up sales comp plans. So the company would do a sales comp plan, they would show it to Bob, he'd hate it, or they'd roll it out, he'd hate it, he'd back it back out. And then we came along and they said, look, Bob, you know, Bob doesn't do well with sales comp plans. We're have to figure out what to do here. And so what we did is we said if we could ask Bob five questions, what five questions are we to ask him? And we said, let's ask Bob what's important him as a CEO in the area of customer priorities and product priorities, and then coverage or organization priorities, and then talent priorities or people and then financial priorities. So we took this idea and we applied it to another company recently. And this is a company in the medical technology business. And we asked them these questions and I wanted to take you through an example of what we did for them in terms of the fact finding and the analytics. So we said, what's important from a customer standpoint? They said, well, new customer acquisition, that's really important because we need to get more market share and we also want to get current customer penetration. So we want to grow our current customers as well. But new Customer acquisition. Really, really important. Okay, product. What's important from a product standpoint? Well, we want to sell the most profitable products and we want the high volume products. There are certain SKUs that are high volume, high profit and it's the combination of those two that are most important. And we of course want to expand our portfolio within companies, but the profitability is the critical thing. Okay, coverage. Well, from a coverage or sales organization standpoint, what are you thinking about in terms of priorities? Well, new customer hunters, those Dobermans. We need to have people going out and finding new business for us and we need strong participation and goal attainment. We want a lot of the team to be participating and hitting quota. We think that's really motivational and we want to make sure that when they have those goals that they're aligned to market opportunity. They're not just goals that are based on history or other factors. Really wanted to be market opportunity based. Okay, well what about the people within that coverage model? The talent? Well, we want to get the best people and we want to give them high earning opportunity. We know in order to get those top people, those top sellers and especially those Dobermans, we've got to give them great earning opportunity in order to get them on board. So that's really important. And then finally financial, I mean super important, foundational component of the C level goals. What's important financially? He said, well, continued productivity growth. We need people to be doing a little bit more every year and we need goal attainment, not just revenue. We don't want people just bringing in revenue. We want to make sure they're hitting their goals because some territories are bigger than others, some territories are tougher than others. So we want to make sure that those goals are hit by people, not just production of revenue. And we need profitability like we mentioned with the, with the products. Profitability is really important. So we said okay, great. So we, we understand what's important. So now we know what kind of things to start to look for. As we're doing our analytics and we're doing our fact finding and we're doing our interviews, we know what we're looking for. We're not just doing a scan of the entire body. We're starting with some, some, some beginning points to look at. Now we have our C level goals, let's talk about the story. So it's not enough to just take the C level goals and say, okay, let's start doing analytics on those and let's start investigating them. We need to understand the story of what's going on in the organization and what happened. So let's take a deeper look at that story. Okay, so we talk about this in the book, design thinking to solve your biggest sales challenge. And we talk about the importance of the story. We talk about Jimmy the mechanic and how he understood the story of my daughter's engine and how it died. And then you can read the book and take a look at that story. But this talks about the basic approach and it works for simple problems and it works for complex problems. And the thing about the story is you need to understand what's happened within the organization. And if you think you know what happened from your perspective, you probably don't know the whole story because you only know it from your perspective. Right. So what we want to do is you want to understand what are the pain points in the organization. So what's been going on? How and when did it happen and how did it evolve? Who was involved in terms of maybe roles or people in the organization? Where did it happen in the organization? Perhaps it was in certain geographies, perhaps it was in certain markets or certain segments. And then why was it done this way? So the story starts to build out what we want to investigate further. So as you start to ask questions about the story, you're going to understand what kind of things you want to do analytics around. Okay, so connect back on what I said earlier about just not doing analytics without a cause. This becomes your cause here in terms of understanding the story, because you now know two things. You know C level goals, what's important, and you know the story about what's happened. And that story is going to start to provide you insight later. So super important that you do this now. We're building some rising action. And in the analytics here, the analytics are going to tell us what are the other parts of the story, Right? So we want to know what happened and why did it happen. So we don't want just hearsay. We want factual information about what happened within the story. So let's dive into the analytics. I want to take a look at a sample of analytics that we ran for this particular situation and show you how we put it together as a story. Okay, so we got C level goals. We have the story and then we have the analytics to start to investigate. So let's start to dive into this. Now. We have this idea called the sales compensation diamond. You guys have seen this before. It's in the book, what your CEO needs to know about sales compensation. And we talked about it a lot. And the reason we do is because it works, right? Because what it does is it brings up the essential components of how you evaluate sales compensation programs and how you design sales compensation programs. So you don't start at the bottom with the mechanics or the commissions, you don't start with the upside, and you start in the middle with the C level goals and you start with the sales roles and those are the foundations for the sales compensation program. And then we work around the major components of framing the plan. So your pay levels, your pay mix the upside potential. We start getting into linking pay and performance together so your performance thresholds, your measures and priorities and the levels and the timing of those measures. And we start getting into aligning the team and financials, start getting to the mechanics and making sure the plans are congruent across the entire team and then the goals are set correctly. And finally we get into operationalizing the plan for results. Well, every one of these areas has an analytic that you can run or really a bunch of analytics that you can run. You can see everything from pay benchmarking to looking at the upside and downside, to looking at the priorities and the cycles and the motivators in the different parts of the plan. And the thing is, you don't want to necessarily start focusing on all these again, know what your whole arsenal is of analytics that you can run and then start to select them carefully in terms of which ones you want to run. Right. That's going to maximize your efficiency and it's going to maximize your focus. So keep this sales comp diamond in mind as kind of an anchoring point as you're going through doing your analytics. So exploring the story and building the action. Okay, so we're going to start to get into what analytics we want to look at. So we've investigated the story and in fact we haven't really done the investigation of the story with you right here, just in terms of time, but we're going to focus in on the analytics piece. The story piece would involve interviewing and talking to people and understanding and filling in all those components. The analytics are going to start to then inform the story. We're going to start to pepper those throughout the story. But what did we say in terms of the C level goals? Continued productivity growth, new customer acquisition, selling the most profitable high volume products, extracting the best talent with high earning opportunity, focusing on goal attainment rather than just revenue production, getting strong team participation in that goal attainment, and aligning market opportunity to the goal. So we want goals that are based on market opportunity, not on History. Okay, so we know some things that we're looking for. So if this is important to the organization and we want to make sure that sales compensation is supporting this. So let's jump into some of these analytics. So first thing I like to do is I like to look at the high level and I like to look at where the organization is going. And we looked at this over a several year period. You can see five years here, up, up in front of you. And what we saw was that bookings were increasing for the organization, but then quotas were increasing faster than bookings and the overall goal attainment was decreasing. So you can see that that dark dotted red line heading down, that's the goal attainment of the organization. That's not a good thing. So that's telling us something's wrong. Right? And we need to start looking at what we're gonna, what we're gonna do because there might be something involved with sales compensation is driving that, or maybe there's something to do with sales strategy. So big picture, we see an issue in terms of growth. Let's look at how we're growing. So this is something we call RPN analysis, retention penetration, new customer analysis. And the idea is that companies don't grow from one year to the next in a straight line. What they do is they grow by losing some revenue and they grow by gaining some revenue. So when we looked at the organization, what we saw is they had really good revenue retention, about 87%. In fact, average revenue retention for most companies in somewhere in the 80 to 85% range. So very good revenue retention, customer penetration about 13.7%. So not bad. But the problem with it is it was just replacing the churn or the loss of retention. And so what that means is we're just kind of treading water by replacing what we lost within customers. And the new customer selling something that was really important to them, only about 4.5%. So that's not a good thing. So it's saying, well, new customer selling is a big priority, yet we don't see a lot of that happening in the organization. Let's dive deeper. I like to look at the organization more specifically and what you can see right here is you can see individual salespeople. And these are just a sample of salespeople. And we looked at the question of, well, how are they growing? And what you can see by individuals is that we've got them broken out by retention, penetration and new customer acquisition. And you can see by the color patterns there a lot of Retention going on a fair amount of penetration and, and very little acquisition. So we can get down to the rep level and we can see maybe what's driving that. Is it a talent issue, is it a focus issue, Is it a sales compensation issue? So it's important to get beyond the summary level of the organization and see what's happening within the individual reps. Now the pay mix is an important piece and remember, that's up on the upper right hand corner of the sales compensation diamond. And if we want to drive hunting or what we think of as Doberman behaviors, we're going to want to have a pay mix that's fairly aggressive. That's driving behavior, right? So if you think about our canine model that you see here, on the right hand side you've got your Dobermans off, on the right hand side you've got your retrievers in the middle. They're the ones going out within current customers in their own backyard and finding opportunities there. And then you've got your colleagues, the ones that are kind of protecting the fourth, the, the service canines. And what we found is as we looked at Paymix at the 50th percentile, it was about a 65, 35 mix. It wasn't really oriented toward new business growth. One thing that really concerned us was on the upside. If you look at the right hand side of that pay mix chart, you'll see that the dark blue bar is really large. What that means is that some of their top earners were earning their pay through a lot of base salary and not as much incentive. And that's concerning because we'd want to see the opposite. We'd want to see the, the incentive getting larger and larger. So a little bit of a concern on the pay mix and also maybe a hint of concern on the upside. So we said, let's take a look at upside further. So this one is a really cool view. Here is the upside and downside chart. And I want to show you how this works first. So if you look along the x axis, the horizontal axis, what you'll see is percentile of quota attainment. So that's going from the first percentile performer on the left hand side to the hundredth percentile performer or your top performer on the right hand side. So it's just sorted in order of performance. It's not percent of quota attainment, it's percentile of attainment. Okay. So for lowest to highest and on the vertical axis you've got percent of target incentive earned. So it's basically the percent of it's basically earned incentive divided by target incentive. So if you had $10,000 of earned incentive divided by $10,000 of target incentive, 10,000 divided by 10,000 is 100 or 1. Right. So that would give you 100%. So if you look across the 100% on the vertical axis, what you would see is that green cross that lines up with approximately where the quota performer, the app quota performer would be. In this case it's about 50th percentile. What's concerning here though is the blue cross that you see off on the right hand side, that blue cross is showing people at the 90th percentile of performance on the horizontal axis. And what it's showing is that they're only earning about 130% of their target incentive. And so the big concern there is a high performance plan. In fact, in this industry the plans are paying 200 to 300% at the 90th percentile. So they're actually underpaying for 90th percentile performance. So the plan doesn't quite have the upside or the goals aren't set such that people are able to get to that upside. So that could affect their ability to attract and retain top talent. Another piece of the story. So we wanted to look at how are people earning their money? So what comprises compensation and how are people getting paid? And we look at a classic pay and performance correlation and on the left hand side what you'll see is incentive payment on the x axis, the horizontal axis, combined with the performance to quota attainment on the vertical axis. So quota attainment percent. And so what you'll see, all these blue dots represent individual people. And what we're seeing here is that we have a scatter, basically it's kind of like a shotgun. So we have people that are getting paid significant amounts, but they may not be getting paid according to quote attainment. So then we took a look at absolute revenue rgus, revenue generating units and we looked at the same axes here. So incentive payout on the horizontal axis and we looked at actual dollars on the vertical axis and we saw a high degree of consistency here. So what that's telling us is the plan is paying for revenue. And what's concerning is that when we take this and we combine it back together with that RPN analysis and at the individual level, knowing that we have a lot of retention and we have a lot of penetration, what it's saying to us is that we're actually paying a lot of money for that. Because all this Revenue is probably not brand new revenue. They're probably babysitting their bases of business. That's concerning, that's not driving a growth culture or a growth type of organization with the incentive compensation plan. So yet another piece of the story. And then they talked about products and they said, well, we want to make sure that our most profitable and highest volume products are the ones people are focusing on. And what you can see here in the upper right hand corner, that green quadrant is high volume, high profitability products. So we've got volume on the horizontal axis and we've got gross margin on the vertical axis. And the strange thing is it's about 21%. So it's about a fifth of the products they're selling are high profit and high volume. So what that's telling us is that the rest of it, the other 80% are either lower profit or lower volume. And that's not aligned with the C level goals. So something is not driving that either in terms of product availability or people knowing how to sell the products or perhaps the compensation plan is driving. Okay, now finally looking at the goals and goal attainment. Remember they said, well, we want to make sure we get great participation in terms of quota attainment and we also want to make sure that the goals are based on market opportunity. So this is a standard histogram and it looks at on the horizontal axis buckets of quota attainment percent in 10% increments and on the vertical axis looking at the number of reps and what you'll see is only about 30% of the organization is at or above quota. And that's compared to what we typically want to see of 50 to 70% of the organization at or above quota for a high performing organization. So a bit of a problem there. So you've got a minority of the organization that's actually in the money in terms of target compensation and above. And what's also concerning is when you look at that vertical dotted red line, what you'll see is that you've got a big group of people, it's about 27% of the organization that's sitting between 90 and 100% of quota. And there's some reason they're there. Maybe they're not motivated enough to get the quota. I don't know. Maybe it has something to do with what happens to them when they get to quota. Maybe their goal goes up, they get a bigger goal next year. So maybe those are actually the smart reps that are just hanging back just a little bit below because they know Year after year, they're going to do better all told, than if they try to blow it out one year. So it's holding back performance a little bit. Most organizations will stop here when they look at quotas, but I want to show you a couple other views that'll tell you some more on the same population. Okay, so what you'll see here is looking at a trend from year one to year two. And, and you can look at multiple year trends on this as well. And what I'm looking for is I'm looking for consistency of quota attainment. So people were lagging in terms of being below quota in that prior example. But what I'm seeing here is I'm seeing again a scatter plot, right? So what I'm seeing is, I'm seeing that somebody did well in quota on year one, didn't do so well in year two and vice versa. So they're going back and forth, they're doing what we call porpoising, right? So they're going up and down and up and down. And that would indicate perhaps a historical goal setting process. So what happens is I do well one year I get a bigger goal, then I don't do as well the next year I get a smaller goal than I do well because I had a smaller goal. And it goes back up and down and it goes on and on. So that's a little concerning. Let's take another angle on this. With the same population of people, okay, so you see the same population and now I'm just looking at absolute bookings. And with the absolute bookings, what I'm seeing is a lot of consistency here. So you see a very high R squared, it's over 0.8, which means it's a really good fit or high correlation between those two. So what it means is that you've got a lot of people that are chugging along at the same production level year after year. And we looked at this for multiple years. So what that's telling me is people are moving along and they may not be at the level of productivity that we want from some of the analytics that we saw before. But, but they're moving along. But what's happening is they're steady but the quota keeps moving back and forth, right? So the organization keeps trying to catch up with them in terms of setting quotas year after year. So we have a historical process most likely, and it's not market opportunity based. So just through the analytics we learned a ton. Now let's put them all together and this is the Climax of our exciting adventure. The big story. So I want to share with you what this looks like, because that's a lot to share, right, with a C level or somebody on the compensation committee. So the big story. Well, we know what the big priorities are and we talked about those before. Productivity growth, new customer acquisition, et cetera. And I borrowed the format that we used earlier just for simplicity, to show you what we could do. And there are a lot of different ways that we could do this. So in the area of growth, while quotas are increasing faster than productivity and we're having declining goal attainment for the company over time, historical growth has been retention with minimal penetration. We have little new customer selling. About a fifth of our products are the high volume, high profit products, which is kind of the opposite of what we want on a compensation front. The paymix is promoting more account management behaviors. We have limited upside potential, so that's probably going to limit our ability to attract and retain the best talent. The plan mechanics pay for total revenue rather than goal attainment. So we're paying people to do a lot of retention and a little bit of penetration selling and not a lot of acquisition. And we're rewarding those managing those larger bases. And then when we look at goals, about 30% of the reps achieve quota. And so that's kind of the opposite of what we want as well. We've got sporadic year over year attainment, but everybody's chugging along pretty much at the same speed one year after the next. And that may be driven by a historical quota setting process. So we have a great opportunity to improve the program and drive our strategy. Okay, so stop for a second and think about this. If you showed something like this, a simple idea like this, to a C level team, or your compensation committee, or the heads of sales or whoever it may be, isn't this a lot easier to understand than a lot of analytics? You put it together in a very concise format. Now there are different ways to do this. You could use other visuals, of course, but you've got a very tight storyline that you're able to talk through. And the best part is it's visual and it's memorable. It's almost like what we call a laminator, right? You could laminate this and they could carry it around and go, I know what's going on with it. And you're starting to build commitment to what you want to do with the compensation program. So we took all those analytics, the C level goals, the story, and we started to put it together. Into something that's a really concise short story that you can use for your organization. Now, solution vision. We'll just spend a minute on this. Solution vision helps you to get to resolution. So what happens in the design process after this is we say, well, if all those things are happening and like that line at the bottom of that last slide that I showed you, we've got a great opportunity. What does that opportunity look like? What's the vision for where we could be in the future? So you want to create that vision. So I want to talk about that for a second and what you'll notice, the solution vision, it creates direction and it looks a lot like the opposite of understanding the story. So what's a successful outcome? I like to think about the metaphor of being out in the meadow. So we're going to go out and we're going to go a year out in the future and we're going in the meadow and we're going to sit out there and we're going to go, okay, we're finally here. What does it look like? How does it feel? How did we get here? And then we know what an outcome looks like. So what's it look like? How and when could it happen? Who should be involved in the organization? Where should it happen? Geographically, parts of the organization, certain segments, certain markets. And why would this be successful or maybe not successful? And that last line is probably the most important why. Right? Because that's what you're going to use to sell the idea, to sell your recommendation of where you should be going with the compensation program is the why. That why has got to be really strong and you've got to be able to make the case. So keep that in mind when you're doing your analytics. You're building your story and you're coming out with that concise those concise points. It's got to be engaging and motivational and it's got to be able to make your case with those analytics. So I'll sum up with a few story based analytics principles. So if you can take away a few things from this, here are some things you should take away. Number one, anchor to the objective, the C level goals. You have to know the C level goals of the organization. You have to know where the organization needs to head. And that's critical because you're contributing to the overall strategic direction. Number two, explore the story and think in questions. So as we were building that story, we were asking questions and we didn't ask them all here in this one conversation, but we were Asking questions about, well, what does this tell us? What else should we investigate? Those questions again, are going to be provocative and they're going to help you sharpen up your challenge questions so you can do a better job of solving that problem. Number three, build tension or alignment with the objective so you don't always have to be contentious. But in this particular situation, the C level goals were not being supported by what we saw in the organization. There's a tension that's building, right? The plot is thickening. So you're going to build that tension in order to get that commitment. Or it may be the opposite and it may be more of a pastoral scene and things are going really well. And hey, you know, the analytics are showing that we're right on track. Couple of adjustments and we're good. So make sure you're focusing on your intended purpose with those analytics. Make it visual. Number four, so make sure that it's easy to understand. Use metaphors to try to explain things. I love metaphors because people remember metaphors, they remember ideas. And then number five, simplify and deword. Okay, so simplify and pare down D word to get down to the essence of your story. So don't try to have too much in there. I know with analytics we're always tempted to have all the footnotes and everything. Put it in the appendix. Keep the simple story, right? So if you think about that story we showed you before, you could show that as your entire presentation and then you could double click on any of those little bubbles that you wanted to to say, okay, well let's look at the analytics supporting that. And man, people will remember that a lot more. So five principles to remember. So as we're summing up, thank you for joining us today. Some things you can do. Every Friday we have the Rethink Sales Roundtable at the Sales Globe studio. And that's at 1pm Eastern time. You can join that go on our website, salesglobe.com and you can register there and you can talk with us about any of your tough sales challenges as well, things you're trying to solve for. You can contact us at info salesglobe.com and one thing you can do right away is you can get some additional information on analytics. We've got a whole chapter on analytics in the book quotas that goes into some of the questions that you can answer and the analytics that are associated with those questions. Just shoot us an email on that. We'd be happy to send you one of those chapters. So really happy you joined us today. Hope this gave you some ideas to think about, some tools to use. I would say don't try to pull it off all at once. Like a lot of the creative approaches that we show you, take little pieces at a time. Practice them. Some of them will be uncomfortable. Some people will say, what are you doing with that story thing? That's kind of corny. You got to practice it. You're going to get rejected here and there. That's totally fine. That's part of the creative process. So you're going to have to practice that. So we're going to stay around for a few minutes. We're going to answer any of your questions, and again, feel free to contact us as well. Thanks, everybody, for joining us.
More from SalesGlobe




Sales Compensation for Results - Course 1: A Strategic View on Sales Compensation - Trailer

Freative Friday - Episode 98 - Insight in Your Hunt for The Revenue Roadmap Pt 4

Freative Friday - Episode 97 - Insight in Your Hunt for The Revenue Roadmap Pt 3