📊 Delphi Insights Workshop | Master Your Digital Mind’s Impact (April 2025)
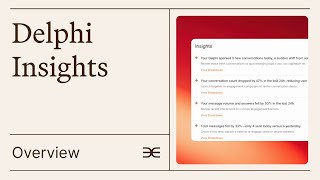
A walkthrough of the Delphi Insights dashboard showing how to add and customize widgets like Mind Quality Score, Broadcast Performance, Sources, Popular Questions, Metrics, Active Users, Unanswered Questions, Product Mentions, and Audience Insights. You can filter all widgets by timeframe and medium, and set defaults for your view.
Chapters
Hey everyone.
Looks like we have a good group today. I'm recording this as well, so feel free to kind of tune in, tune out as you want. I'm going to be going over the entirety of the Insights dashboard. Like our other new features workshops, we don't have microphones or any of the chat enabled, so that we can just kind of dig into the features, um, and I can walk you through it step by step. If you have any questions following up this workshop, feel free to send them to supportelphi AI and somebody there will get back to you soon. Um, but in the meantime, I'm gonna start sharing my screen and we're gonna dive into this.
Okay.
There we go. All right, so.
The first thing that we're going to start with is I'm going to make this screen as big as possible so you all can see as much as you possibly can. But you can take a look at the fact that I've got two different Delphi's open. So I happen to be on two different people's accounts as a collaborator. And so I've got Dara's open, who's our CEO and co founder, and then I have Alvin Alifatz open, who is one of our senior engineers here. And so I'm going to be jumping between these two to both show you how to add all of the widgets, but also to show you some of the pre existing ones that I've got loaded into Dar's Delphi because he has a bit more data than the rest of us do. So why don't we start with what it looks like to add a widget. You're going to edit the layout which is going to be in this top right hand corner right here. Ignore these two for now. We're going to come back to them at the end. So we're going to edit layout, then we're going to click Add widget. Here is the widget library. This is where you can see all the different things that you can do and I'm going to go over each of these in order. You can also search for them though. So if you know that you want to add popular questions or popular topics, search there instead of having to scroll and find it here. So let's start with Insights. This is going to be what is just a general overview of things that we think are important and we use an intelligent system to determine what insights might apply to you. So like I said, Alvin's doesn't have much data because it's really just him testing it for internal use. But you can see here that he has four different insights. You can see that it was three new conversations were sparked today, which maybe this is something that he'd want to capitalize on if he was a creator. He has a certain amount of drop in engagement, he has different message volumes answering and falling, and then the amount of messages he had fell. This is Alvin specifically because he doesn't have a ton of data. But if you look at Dara's, you can see a little bit more granular insights. Here we see tech savvy users demand control over clone configurations. And so the point here is that while Alvin's is mostly focused on data because there's not a ton of topics that we can really use to analyze and give him insights on what his audience is looking for. And Dara's gives a ton of data and a bunch of users. And we can see that from people talking with his Delphi to tech savvy users are really looking for being able to have specific configurations. We can go deeper though, and even get specific insights into what they're looking for. They want to duplicate instances, they want to disable sharing, they want unwanted charges to be more clear with exactly what they're getting charged for. They want to customize certain kinds of behavior. So for every insight you get, you have the general insight, the ability to click between insights, the ability to go deeper on any given insight, and then you also have the ability to use these bottom three dots here to click View all insights and see them all at once, in addition to seeing that specific deeper dive by clicking on View Breakdown. Lastly, for any given insight, you can say whether it was helpful or not helpful. So let's say that Alvin doesn't really care much about reduced user engagement from like the last 24 hours. And this is not something he really cares. He can teach his LLM that this is not something that's helpful to him, but this is something that's helpful to him. So he'll note it. And this way it can learn exactly what insights are useful to you and which ones are not. So that's going to be the first component.
The second thing is going to be what's called your Mind Quality Score. Many of you are probably already familiar with this because it exists within the platform already. I'm going to drag it up here so you can see it in its kind of widget form.
So your mind Quality Score shows what exactly training you have done and what percentage you're at in terms of how much data you've uploaded relative to the content that we've prescribed as important to your mind. So we give you a bunch of topics using an intelligent system that tells you what are the topics that you're interested in and an expert in you. Then upload data to match those broad topic areas and we tell you how to how close you are to really having a ton of data for this to be meaningful. Here you can scroll through and see all the different components that we think are really important and have found to be really important for a good Delphi profile. So, for example, if you don't have a bio, we found that people don't really like interacting with your Delphi and it reduces the training data. And if you don't have your socials, that's also something that's going to hurt you in the long run. So we've created this handy checklist for answering questions about yourself, making sure that you customize suggested questions. And you can look here and see all the different things that we believe are crucial for you to get the most out of your Delphi and are things that are sometimes overlooked. So sometimes we don't see people edit their initial message, which is a huge missed opportunity. You should have a custom message greeting your users every time they start a new conversation. So that's going to be the Mind Quality Score.
But now let's add another widget. This one's going to be broadcast performance. Now, neither Dara nor Alvin have sent out broadcasts via sms, however, so it says no broadcast data available. I have two screenshots that I can show you of what it would look like if you were actually sent out a broadcast. This is what the widget would look like. So this small feature right here would appear in this format. You'd see latest broadcast at the top. I've blacked this out because it's coming from one of the profiles of one of our users. But here you can see that this would be where their title of the broadcast is, so they know what broadcast is being talked about. You can then see the open rate in a percentage format. So maybe it's like 0.5%. Open the click rate again in the same format, your unsubscribe rate for that specific broadcast and the engagement rate. So this is going to be the small widget that appears right here and it's only going to apply to your latest broadcast. If you did have broadcast data though, what you could do is click on this specific widget and it would expand. Then you would be able to see broadcast performance over whatever period of time you choose to Filter by and this is going to be your top three latest broadcasts. So this one is going to correspond to what you saw in the small widget format because it's your most recent broadcast. This one's going to be your second most recent broadcast. Again, you would have the title, the open rate, click rate, unsubscribe rate, and engagement rate. And of course, this would be your third most recent broadcast, and so on and so forth, depending on how many you've sent over the period of time you've filtered by.
Now we'll go back, I'll close out of these.
And we will add another.
This is sources. So this is going to describe what most popular sources are being cited in Answers for your Delphi. You can scroll in the individual widget and see in a very small version what your most popular sources are, but you can also click and get more information. So in this case you can see we can filter by different day ranges and you can even click into any individual citation and see more information about it in addition to viewing the document. Dars Delphi actually is a really good example of this. Here you can see all the different ones that have been cited in the last seven days at the top, or the most popular citations, but it also shows the reference sections of that particular piece of content. This was from a Forbes article written about Delphi, and you can see all the different parts here as it's publicly available. But you can click into Dara's Delphi and actually see which of these sections are being cited the most. In addition to viewing it, you can see what type of content it is, how many citations it has, and the reference sections.
So here you can also click, for example, it'll show you Twitter and then you can go look at your Twitter tweets. That's going to be the most popular sources widget. And again, when you click into it, you can filter by different days, which is really useful. Okay, go back to Alvin's.
And now we can add another widget.
Let's do the popular questions 1. Again, Alvin's doesn't have very much data, but you can see here that this is what the widget would look like. You would click edit, add, and then you can see your popular questions appear down here at the bottom. Dars Delphi is going to be a better source for actually looking to see what popular kinds of questions get asked. So here you can see this is what the basic widget looks like and how you can scroll within it, but you can also click on it, filter by time frame and See different kinds of popular questions. You can then click on any of these questions and see what similar questions get asked beyond what is Delphi? People ask what does Delphi really do? And you can see how many conversations this has been asked in recently, in the last seven days. It hasn't been asked in any conversations, but perhaps within a broader time frame. That's actually a really popular, similar related question.
Similarly, if you wanted to look at popular topics, you would click Edit Layout Add Widget.
Either look it up or scroll and click Popular Topics.
Now you can see down here Alvin again doesn't have enough training data or enough questions asked of his Delphi, but that's how it would appear. Dars, however, has all of these different popular topics listed within the widget. And if you click.
Again, you can filter by time frame.
But you can also click on any individual topic and see if there are any subtopics found for this particular one. So especially if you're getting a lot of data on something, which in this case Delphi integration is a good example, it has action, setup, slack integration, SMS integration, and these are the kinds of subtopics that people are asking about when they're talking to us about Delphi integration generally. So you can get specific insights as well into a particular cluster. Again, that's using our intelligent learning model that gives you these kinds of insights.
We'll go back to Alvin's and now I will show you how to add the widget for metrics.
So this is going to be our metrics widget. This is where you can have a certain set of different tiles for whatever you choose. These are going to be all of your tiles, but it's a little bit easier to understand in the context of these sidebars. For example, there are revenue and subscription tiles. So maybe you want to know what your total revenue is and your total subscribers are, but you don't really care about how many unsubscribes you have.
These are user metrics. So you can take time. You can look at how much time you have spent creating your Delphi, or you could look at how long the average session duration of any user of your Delphi is, so see how much time they've actually spent talking to it. You can see your total number of users, but you can also see active users on any given day. Additionally, you can see how many new users you get. And as you can see here, you can only add up to five tiles. So if I exit out of this one, I can add two more because I've got three added from here, but now I'm going to give myself three more and I can keep picking and choosing or I can just say that I'm done and only have these two.
Lastly is communication metrics. Here you have how many SMS recipients you have. So how many people have opted into your sms? How many SMS declined users? So how many people have opted out where you can't send to them? How many messages have been answered by your Delphi? So this is the actual number of messages sent by your Delphi to anyone else? How many messages have gone unanswered? So questions that people don't know the answer to just as yet. How many total messages have been sent to your Delphi and how many total conversations people have had with it? So I've added these four. I have one more, but I won't use it and if I did, it would say I've hit the max and then I wouldn't be able to add anymore. And I'll add these and it can reorder them within this widget frame and I can now appear and see what all these different things are. So here I will click Add widget. It's going to take a second to load these different metrics.
But within Dara's we can see active users, how many he's had? So 485. And that's based off of the time frame that's up here. So if I wanted to change the timeframe for this particular widget, I could do it from up here because it doesn't have this last seven days or trending, et cetera. Instead I could change it to the past three months and then this number would change. So you can see active users here, how much it's gone up by over the last seven days because again, that's the time frame that I have up here. The time spent creating. As you can see, this is the amount that Dara has spent creating his Delphi and how much it's decreased or increased over the last seven days. The message is answered and how much it's increased or decreased and the message is unanswered. And this will apply for every different kind of widget that you add in. So if you want to change and customize, you can swap in and out different tiles. So maybe I want to add average session duration or realistically I might want to add something like SMS recipients. I click done and then you can edit the order and save it. The customize feature is currently still being developed, so what we would recommend is that you would be able to Put it in by clicking here and adding a separate one for the different things that you feel like adding in. So you can have two of these widgets, for example.
And that way you don't need to only have a restricted amount to 5. You can have as many as you want across multiple different widgets, even for the same one. And that applies across all these different things. So as a brief interlude, and I'll go over some of this stuff again later, but just so I can explain this idea while I'm on it, you can see that you have this trending in the last seven days. Most popular questions. But you could also add a second most popular questions widget and draw that upwards.
But edit it.
So that it shows something like the last three months. And then you can have two different ones on different frames to be able to view them between. It's much more useful for something like metrics, where you actually have different frames and you don't need to go back and forth between them. But it also applies to some of these other widgets. All right, so that covers the metrics tile. And now we'll go over Active Users. To see your active users, you'll click Edit, Layout, Add Widget, and then you'll go down, you'll click Active Users, and you'll see who's engaging most with your mind. So in this case it's just going to be Alvin, because he's the only person that's currently talking to his own mind. However, if you have a large user base, you'll be able to see them and scroll down between them. You can click on them, and you'll also be able to see and scroll between all these different ones across various different time frames. This is not something I'll show from Dar's Delphi, since we don't want to give up any personal information of people who have been asking his Delphi questions. But your users will likely appear down in this section and you'll have more people that you can scroll between and filter in different timeframes and see who your top users are and how many questions they've asked you.
The next one is going to be adding in a user spotlight.
So this is going to be insights about particular users that are interesting. Joe is another engineer at Delphi, and it seems like he was asking at one point Alvin's Delphi questions as part of our testing. So what you can do is you can click on messages and you can actually see the kinds of messages that are being asked by this interesting user. A good example. Again, not Showing any personal information of what this would look like if you had more users is here. You would have their profile image, their name, a quick description of what they're interested in. You could click into their messages, or you could click Next and go to the next user. So if you had more users in your database and multiple people who are seen as interesting, you could click between them and see all of them within one spot. So that's going to be User Spotlight. The next one is going to be Unanswered questions, which I was not able to find any examples of people who have unanswered questions in the Delphi. So we're going to leave this here. And when this eventually does pop up, you can see the unanswered questions appear into this data and you're able to answer them from within this widget. However, I don't have any examples of this appearing because all of the Delphi are well trained enough that they're not getting unanswered questions these days.
Okay, onto our next one, which is Product Mentions.
I have to save that.
So Alvin doesn't have any Product Mentions available, but you would add it again by showing Edit Layout and then clicking Product Mentions and it would appear down here. Daris, however, does have Product Mentions. So you can see here that this is an example of a user talking about something to do with Actions. We don't know exactly what the conversation is, but it suggests a product which is here. Clone Yourself. That's part of our offerings. That's what the Delphi homepage looks like. So what you can do for Product Mentions is click Respond. See this widget? Very basically what the mention is, click Respond and you can actually type a response to the user on the spot.
Alternatively, what you can do is click Next. And I know that the next person isn't anonymous, so for the sake of this demo, I won't do it. But you can click Next and you can see multiple different Product mentions and respond to them all within one place.
The next example is going to be Quick Actions. This can sometimes take a second to load, so I've chosen to pull up a screenshot of it instead. What you can do with Quick Actions is click Send a Broadcast, Create a membership or Promote products. So you're going to add it just like we do with all the other things, by clicking Edit Layout Add Widget and then clicking Quick Actions. Again, this takes a while to load, so I won't show it for the sake of this demo. But you can see here that Quick Actions, you have these three things. And if you click on any of them, what it'll do is take you to the part of the Delphi studio where you end up taking these actions. So if you click Send a Broadcast, it'll take you to the broadcast page. If you click Create Memberships, it'll take you to the memberships page. And if you click Promote Products, same there.
So for our next widget, it's going to be meetings, which I have a screenshot of here as well, because I'm not going to be able to show you any confidential or personal information for meetings. But to add it, you would click Meetings, you'd click Save. Alvin doesn't have any meetings on his calendar, so it's appearing as no upcoming meetings for him. But for someone like Dara, he has these two meetings today. And so you would be able to see both of those meetings on his calendar as integrated within his Delphi. And even cooler than that is if they're meetings on Zoom, you're going to be able to click on if you want your Delphi to attend or not attend, if you want it to attend via video, or if you want it to attend via chat. So this is how you're able to manage your calendar and whether your Delphi is attending with you or in your place via video or chat, or not attending at all.
Okay, our next one is going to be the activity chart.
Which you'll scroll all the way down here for. You can see the activity chart and choose between these different widgets. So you can see messages sent users conversations, which sometimes it takes a second to change, and you might have to click in and out in order to be able to see. Also, Alvin's is not a great example because there's not a ton of people interacting with it right now. And you can also see revenue. You can eventually add the widget.
And change it later. So I'll click Save up here, I'll scroll back down. This is Alvin's revenue. He doesn't have any revenue. This is not a delta slide that's been monetized, but you could click on it and see these changes between here as well. And if you wanted this to become his default widget instead of revenue, you could opt in for this to become his new default. And now it would change at the bottom to reflect his conversations. Moreover, you can change the time frame which is being shown within that widget. So for the last three months, he's had a total of 802 conversations. Similarly, on Dara's Delphi, you can see that there are A lot more conversations, but these are all over the course of the last seven days.
So that's going to be the activity chart and you can have multiple of these at once. So let's say that Alvin wants to see both the amount of conversations that have been had with his Delphi, in addition to how many messages have been sent to his Delphi. He can add both widgets and see both next to each other at the same time.
So I'll save that. And then for our final widget, it's going to be Audience Insights. So here you'll click and you'll choose between three different things that you want to see. You can either have language selected and know which type of language is being asked. In this case, two different kinds of English, which we are not entirely sure what happened here, but that would be for Alvin's. There's tags for whatever groups you've tagged and then mediums. So are they asking via web browser, via voice, etc. Mediums can sometimes take longer to load because it's more data across different data sources. But we'll show you via Dara's Delphi, especially because Alvin's only has a couple of different mediums and Daris has a bit more. So here we'll scroll down and you can see that for Dara's Delphi. Oh, that's my Internet connection is unstable. Maybe that's why it's not showing.
We have these two different things which we're trying to fix. But you can see that Italian is the next most popular one. You can also see the tags that we've set. So we have a tag for anyone that we're hiring by, and that's going to be division based off of what categories or what tags are being most utilized. So hiring is by far our most popular tag because it's the one that we have actually set up alerts for within Dars, Delphi and then Medium. So most people are using Dars Delphi via embed. That's going to be probably from within the Delphi Studio page, or it's going to be on the Delphi pricing page. Some people are using it via web, so they're actually typing in Delphi AI/DARA, and some people are calling it via browser voice, but only a very small percentage of people. And again, you can set that as the default widget and that'll then appear as the thing that actually is within your default homepage. And now this is overtaken languages. So that's going to be an overview of all the different widgets that you can add. The final things that I wanted to show were how you can manage all of these different widgets. So the first is you can filter all of them by a time frame so you can change based off of this upwards point so that you can see across all of these different ones what kind of interactions have been going on. But you can also filter by medium. So that would be instead of all mediums, maybe you just want to see most popular questions or most popular topics or the amount of recipients that have only been had via browser voice.
See, for the most part some of these are not going to be incredibly good because you probably as you saw with Dara's, There are only 2 percentage of conversations happening via browser voice and some you may not have any interactions for. So maybe you don't have the telegram integration and there will literally be no sources found because you don't have any of these conversation topics. But maybe if you click embed.
In this case the popular questions is not loading. But you can see that we can interact with total conversations only via embed and see how it changes over time. Alvins might be a better example for this, since we can draw these metrics upwards and see how they shift.
Based on mediums. So maybe we want to look at Slack here. It's probably going to show zero across different versions of what he's talking to and sometimes with some of these they're not going to change. It's kind of an experimentation process. Like as you saw with Dara's, we saw some changes across total conversations and some changes across these metrics, but then not in other ones. So that's still a bit of an experimentation process and will be finalized within the coming weeks so that this medium filter will be able to show you exactly the kind of data you want most reliably. Right now what we've seen is that it works for this kind of activity chart the best, which is what we've been optimizing for as that's a use case that most of our customers are looking for right now. The last important thing is you can edit the layout, but not to add a widget, just to delete different widgets. So you can delete it and remove it from your dashboard. You've seen me do this before. But you can move things within your dashboard and as I've mentioned before, you can add the same kind of widget multiple times if you want to highlight different things that are shown within the different metrics or different like activity charts or different features in that way so that's a very broad overview of insights, not actions. It's a very broad overview of insights. We'll be posting documentation on this in the coming days, but we will also be making some adjustments so that some of these features are able to apply a little bit faster. And. And also so that some of these features apply more broadly across all of the different widgets, rather than only working with some of them, like activity charts. But given how much we use, we've already seen users getting out of this feature, we wanted to roll it out as fast as possible and give you guys the ability to play around with it, get some insights into your audience, give us some feedback on what you think of it, and we're very excited to see what you do with it. So, with that being said, any questions you have should be sent to supportelphi AI. We hope you're really excited to use this. We think it has great potential for you to expand your audience and potential with Delphi. And we will see you for our next workshop very soon. Thanks. Bye, everyone.
More from Scott




Business & Burgers-Sequence Collection bracelet for National Entrepreneurship Week