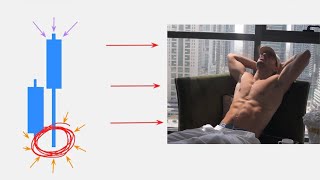
Bullish triple bottom explained

26 Apr 2024 · 0 min
0:09

In this brief instructional segment, the speaker defines the bullish triple bottom chart pattern, noting that it is similar to a double bottom but features three distinct touches of the price level. The pattern indicates a strong support level and suggests a potential reversal of an ongoing downtrend. The explanation emphasizes the pattern’s significance for traders seeking reversal signals.

More from Sean

youtube.com

The BlueSky Setup: The Strategy That Has Made Me Over Half A Million (INSANE VALUE)

1y ago
youtube.com

how not to be like 99% of traders (from a 7 figure trader)

1y ago
youtube.com

Day in the life of a 7 figure trader in Miami (realistic)

1y ago
youtube.com

$5,515/day with 1 simple trading strategy (just copy me)

1y ago
youtube.com

Stop trading meme coins, instead do this.

1y ago
youtube.com

THIS 0.0070 Penny stock just partnered with Palantir (10x Potential !)

1y ago
youtube.com

this ONE minute strategy changed my life (+$1,000,000 in profits)

1y ago
youtube.com

I Bought $40,000 Of This Penny Stock (10x potential)

1y ago
youtube.com

motivation is keeping you poor (here's what to do instead)

1y ago
youtube.com

how to get ahead of 99% of people

1y ago
youtube.com

How to actually win (literally, at anything)

1y ago
See all content