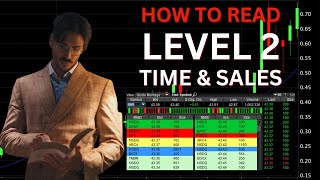
Sean Twizer teaches beginners to read Level 2 market depth and Time & Sales tape. Market-maker codes like GTSM and CSTI map to brokers like E-Trade and Charles Schwab. Red trades signal selling, green signal buying; a surge of red volume on ENDV showed a post-news dump.
Chapters
What's going on everybody, Sean Twizer here, and today I'm going to teach you how to read Level 2 like a professional and utilize time and sales in order to get the best trading possible. So what we got over here is this ticker symbol OZSC. Now currently the market is closed, but this is going to be perfectly fine for today's example. Now what is Level 2? All right, so in order to understand Level 2, we first need to understand Level 1. Now, as you can see over here, we have a bid and we have an ask. These are the level 1. These show us the best bid possible and the best ask possible. That means the price that we can buy or sell at any given moment. Now, next to the price, we have the size. Currently, this says NA because again, the market is closed and we cannot have bids when the market is closed. But Usually it will show you the total number of shares that are on the bid and on the ask, and that's level 1. Now level 2 is where things get tricky. Imagine it like playing chess. All right, here we're going to see different market makers. All right, as you can see over here, we have GTSM, CSTI, CFGN, and STXG. Every single market maker is going to be with different size, and we can actually see the ask as well. And as you can see here, we also have GTSM, CSTI, and CFGN. Again, each one with different size. Now the thing I want you to understand and address with market makers is think about it like code names. For example, GTSM is going to be E-Trade. And CSTI is also going to be E-Trade, but it may also be Thinkorswim, which means Schwab. CDEL, for example, and OTCN are usually code names for Interactive Brokers or Canadian Brokers. So every single market maker usually represents a broker. CSTI, GTSM, and sometimes INTLN usually are representatives of E-Trade. Besides that, they usually represent Thinkorswim by Charles Schwab as well. CDEL and OTCN and sometimes OTCX usually represents Interactive Brokers and Canadian Brokers. And SpeedTrader is usually represented by OTCN. And now that you understand how the market makers work and how we can actually see them, what is the level 2? The level 2 is a representation of the current buyers and the current sellers. Here we can see how many shares every single market maker wants to buy. So for example, let's say me, myself, I trade from E-Trade and I want to buy 1 million shares at double zero one. The way it's going to show, it's going to be GTSM with 1 million shares at double zero one. Now let's say Johnny also trades from E-Trade and he also wants to buy 1 million shares. Now Johnny sends an order that he wants to buy 1 million shares, and it will join the bid at 001. Hence, we're going to see the same market maker with 2 million shares. It may also be represented by another market maker because remember, every single broker usually has more than one market maker he works with. Now, how can we actually benefit from Level 2? So first thing first, it actually shows us the current supply and demand. You need to understand that every single bid and every single ask is a person who is willing or wants to buy or sell his shares, which essentially shows us the current supply and demand. Because if, for example, we have one market maker with a lot of size compared to all the other market makers, we can assume that someone, right, one person wants to buy a shit a ton of shares and he knows something potentially. And if, for example, we can see that the ask is relatively thin to the bid, we can assume that a push up is going to be relatively easy if any news or any updates are going to come in the stock. So essentially, level 2 shows us the depth of the level 1, which helps us better understand if it's one motherfucker who is buying the share or many. And how can you benefit from it? So if, for example, we see a lot of bids coming up after the ask is getting bought up, we can assume there is increase in demand, which means the stock can potentially go further up. And for example, if we can see that the stock has reached the support level and the bid is relatively thin, we can assume it's not going to hold. And if the support is not going to hold, we can actually assume a lot of people are going to dump the stock. Another thing I like using Level 2 for is seeing if someone is loading up shares. For example, if every single time there is an ask to buy and someone buys it immediately, we can see that within the level 2, and that is going to be something that is really, really hard to identify only via level 1. Now you need to understand that every single market maker is usually a person or a bunch of persons. If GTSM really wanted to sell his shares, he could always throw them on the bid, but he decided to sell a 0009. Now, because the market is currently closed, we're not going to be able to see real-time in sales, but I'm going to show you an example. Okay, so this is a previous recording of the stock ENDV. Now, as you can see, we have a lot of red within the time and sales, which means a lot of selling pressure. We can also see by the chart that the stock was trading at 006, and currently there is selling pressure on 0027, which means the stock has gotten sold off. Now, once we see there is a lot of trading volume and the bids are not that strong, we can assume that a lot more selling pressure will come because a lot of people will get panicked and sell their shares. As well as that, what I want you to look at is the volume that there is in the stock. This is the highest volume the stock has ever had. So what we can assume happened here is they released really good news, the stock opened with a gap up, ran up, and then got dumped. Back down. And as we can see, the selling does not stop. That could indicate that there is currently maybe dilution, or that someone preloaded the stock the day prior and is now offloading his shares. So if the time and sales has a lot of volume and a lot of orders, we can understand there is currently something happening with the stock. And if the color is red, that means a lot of people are selling. And if the color is green, usually that indicates buying from the ask, which shows us increased demand. And that is exactly how you can use Level 1, Level 2, and time and sales to trade and make more money. If you enjoyed this video, please drop a thumbs up and subscribe to the channel and comment down below if you have anything else you want to learn about.