0:13
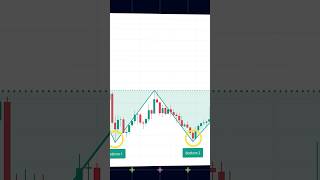
In this brief video, the presenter explains the bullish double bottom technical analysis pattern. The pattern signals a shift from a bearish to a bullish trend. It is formed by two consecutive touches of price at a support level, with a rebound in between, creating a shape that resembles the letter “W”.
More from Sean

youtube.com
The BlueSky Setup: The Strategy That Has Made Me Over Half A Million (INSANE VALUE)
1y ago







See all content