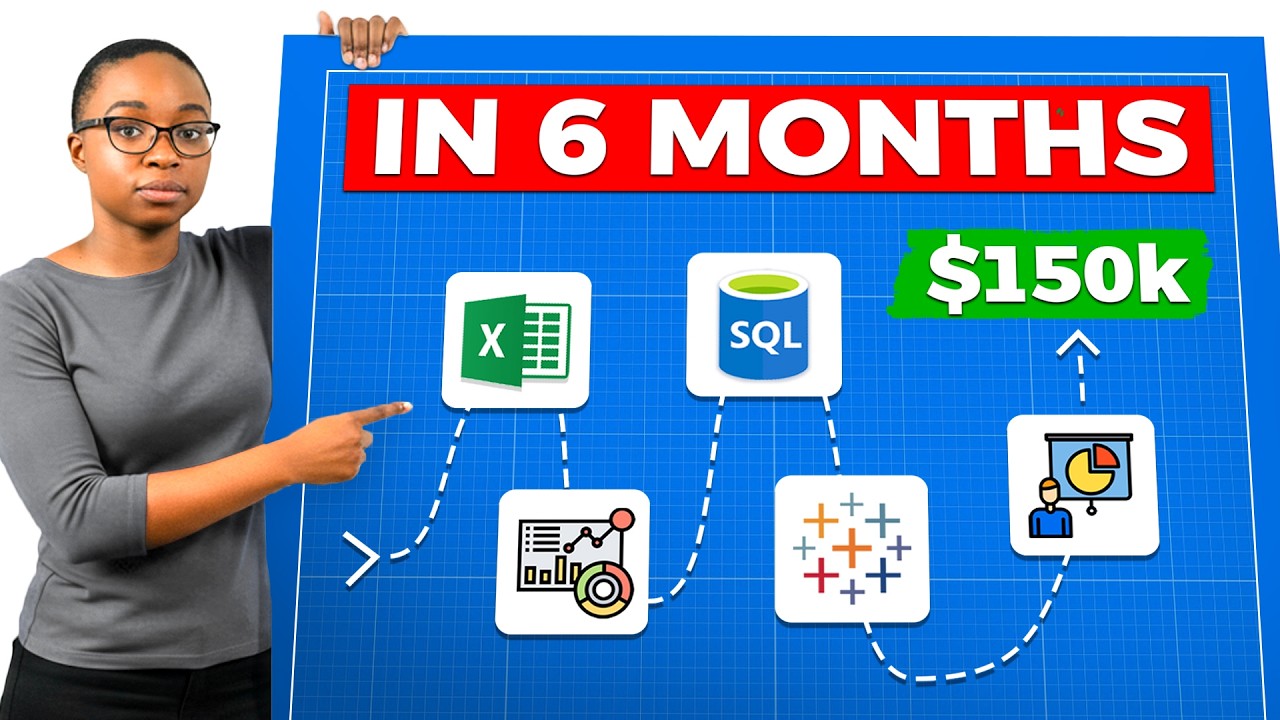
In this instructional video, Kedeisha Bryan exposes why the conventional routes to data analytics—master’s degrees, certificates, or learning unrelated tools—often fail career‑changers, citing market data and hiring‑manager surveys. She then presents the "Elevate Method," a free, six‑month, skill‑first roadmap designed to get candidates hired quickly. The roadmap is broken down month by month: Month 1 builds Excel and analytical thinking; Month 2 focuses on data storytelling and visualization principles; Month 3 delivers deep SQL competence; Month 4 teaches dashboard creation in Tableau or Power BI with a storytelling lens; Month 5 guides the creation of a targeted portfolio, resume, and LinkedIn brand; and Month 6 shows how to generate real consulting experience and craft a compelling interview narrative using the STAR method. Throughout, she backs claims with industry statistics (e.g., 70% of hiring managers prioritize experience over degree, 84% will hire without a degree if a portfolio is strong) and offers concrete actions, resources, and performance checkpoints. The video ends with a call‑to‑action to book a free career strategy session and a teaser for a follow‑up video on building standout portfolio projects.
Chapters
If you're trying to break into data analytics right now, you've probably noticed something frustrating. Everyone online is telling you something different. One person says learn Python first. Another person says go get your master's degree. And then someone else swears you just need the Google certificate and you're good to go. You're sitting there wondering which path actually works. I get it. When I first tried to break into data analytics, I spent months focusing on all the wrong things. I was learning R when companies wanted SQL. I was building projects that nobody cared about. And I see the same pattern in people I help today. So in this video, I'm going to show you the difference between the path that most people take and the path that actually leads to a job. Then I will reveal a step-by-step 6-month roadmap that you can start today for completely free. Most people waste months studying things that companies don't even test for. And if you're switching careers, you cannot afford to waste that time. And if you stay till the end, you will see the one step most people skip that makes the biggest difference when applying for your first data analyst role. So let's get into it. To understand why so many people are stuck, we need to talk about how we got here in the first place. It all started in 2012 when a single article from the Harvard Business Review that called data science the sexiest job of the 21st century. That one headline sparked a gold rush. Universities realized that they can charge a premium tuition for a sexy career path, and the market was flooded. Since that article came out, the number of data science and analytics degrees awarded has skyrocketed over 700%, and nearly 70% of those are master's degrees. This created a trap that catches thousands of career changers every single year. You spend on a master's because you think it's the ticket into that sexy 6-figure data scientist job. Programs range from $10,000 to well over $80,000, and you're looking at 2 years of your life and you think, well, that's just what it takes. But when you graduate, you hit the wall that you never expected. You find out that entry-level data science actually requires many years of STEM experience and a PhD, and you're suddenly too junior for that role that you studied for. But then you humble yourself and you decide to pivot down to a data analyst role just to get your foot in the door. But then the second trap springs up. You then realize your master's degree taught you very high-level theory about algorithms and models, but it didn't teach you the actual boring tools that businesses run on every day. SQL, messy data cleaning, Excel, Tableau, data storytelling and visualization. The stuff that actually gets you hired today. So you end up overqualified on paper but underskilled for the actual work. So that's the broken path, and millions of people are still walking it today because nobody showed them the alternative. First, it's too slow. Tech skills evolve faster than university accreditation can keep up with. Demand for generative AI skills, grew over 6,000% in just one year, according to data from last year. University curriculums take years to update, and the market changes in weeks. By the time you finish that 2-year degree, the syllabus is already a history lesson. Second, hiring managers don't care about it anymore. A 2024 survey found out that 69% of hiring managers prioritize relevant experience over a degree when making hiring decisions. 7 out of 10 hiring managers would rather see what you can do than where you went to school. That's not a preference, that is a mandate for your portfolio. So what does the winning path actually look like? I'm gonna walk you through the exact roadmap step by step, and I call this the Elevate Method. It is the same framework that I use to go from delivering pizzas to making 6 figures in data analytics. And the best part, you can complete this in 4 to 6 months instead of 2 years. And instead of paying $20,000 plus in the hole before you even write your first line of SQL, you're building skills that pay from day one. So let's break it down month by month. All right, month 1, master Excel and analytical thinking. This is where most people want to skip, but don't. I know Excel isn't sexy. No one's making viral TikToks about pivot tables, but here's the reality. According to a 2024 analysis of over 1,000 entry-level analyst job postings, Excel appeared in over 50% of all listings. That makes it practically tied with SQL as the most requested skills. Half of all job postings, and most people brush past it just to get to the cooler skills. Excel is where you want to learn how to think like an analyst. So this month you need to master the following. Pivot tables. This is how you summarize and analyze your data quickly. Drag and drop, create charts from your pivots. This is your bread and butter for quick ad hoc analysis. Lookup functions. VLOOKUP, XLOOKUP, INDEX MATCH. You need to know how to pull data from one place to another, and this is foundational. Then conditional formatting. Learn how to make your data visually scannable. Highlight what actually matters and make patterns obvious at a glance. Power Query. This is gonna be your secret weapon for data cleaning. Most people don't even know it exists. It lets you automate repetitive cleaning tasks so you're not doing the same work over and over. And basic statistics, mean, median, mode, standard deviation, how to identify and handle outliers, understand the different data types and scales of measurement. Why start here? Because most people already have familiarity with Excel. I have yet to find someone who wanted to pivot into data and never use Excel before. You wanna understand analytics in a tool that you already know before you move on to tools that you're learning for the first time. By the end of month 1, you should be able to take a messy dataset, clean up, analyze it with pivot tables, and then draw basic conclusions. If you can't do that confidently, do not move on to the next month yet. All right, month 2, learn data storytelling and visualization. This is where you really want to pay attention because this is also where 90% of your competition drops the ball. You can run a query, maybe you can pull some data, but you have no idea what to do with the results. Data storytelling is now rated as the number 1 most critical skill gap in the industry. 69% of employers listed as a must-have, yet fewer than 25% of candidates can demonstrate it effectively in an interview. So that gap is your opportunity. This month, you really need to understand the difference between data visualization and then data storytelling. Data visualization is taking a spreadsheet and then turning it into a bar chart. That's it. It's just a visual representation of numbers. Data storytelling is taking that same data and crafting a narrative that drives action. So here's what you need to learn. First, the principles of clarity. Every chart should have one clear message. If someone looks at your visual and doesn't immediately understand your point, you failed. Color theory. Color isn't decoration. You use it as direction. You use color to draw attention to what matters and push everything else to the background. Remove clutter. Most people add way too much. Gridlines, borders, legends, labels everywhere. Learn what to take away so the insight can breathe. Next, choosing the right chart. Bar charts, line charts, scatter plots, each one serves a different purpose and learn when to use what. Designing for your audience. How is your audience processing the information and what are they seeing first? What conclusion are they drawing and what decision should they make? Practice these principles in Excel first. Build charts that tell a story, show the cluttered version and then show the clean version so you can see the stark difference. This month you wanna read Storytelling with Data. Not only read it once, but then read it twice. It's short, it's practical, and it will change how you think about presenting information. By the end of month 2, you should be able take any dataset, create a visual that communicates one clear insight without any explanation. The chart should speak for itself every single time. Okay, month 3, SQL. Now we are gonna get into the technical part that separates serious candidates from everyone else. SQL is non-negotiable. If you can't write SQL, you are not getting hired today, period. SQL is the language of data. It's how we clean and transform data at scale, and it's what shows up in almost every technical interview. This month you need to master basic queries, SELECT, FROM, WHERE, GROUP BY, ORDER BY. This is the foundation and you need to be able to pull and filter data without thinking. Joins, INNER JOIN, LEFT JOIN, and SELF JOIN. You need to understand how to combine data from multiple tables. This is where most beginners struggle, so do not rush too fast. Side note, do not even think about RIGHT JOIN. It's just going to confuse you. Trust me. Next, aggregations, COUNT, SUM, AVERAGE, MIN, MAX. Learn how to summarize data and answer basic business questions. Subqueries, queries inside of queries. Then CTEs, Common Table expressions. This is how you write clean, readable code. You need to know when to use a CTE versus a subquery and explain why. Window functions: row number, rank, lag, lead, running totals. This is intermediate to advanced SQL, and this is what you can expect to get tested on in technical interviews for higher-paying roles. Case statements: conditional logic inside your queries, essential for creating categories and handling different scenarios. Don't just take a course and move on. After you learn the concepts, practice on sites like DataLemur or others. The questions are harder than most, which is exactly what you want. You don't want the easy mode. Easy doesn't prepare you for real interviews. Now here's something else that's important to understand. While Python may be huge for data scientists, for data analysts, SQL is requested 1.5 times more than Python for entry-level job descriptions. So if you're stressing about Python right now, stop. SQL comes first. Master it before you even think about anything else. By the end of month 3, you should be able to confidently write complex queries from scratch. If someone asks you to explain a window Function or CTE, you should be able to answer it in your own words. Now month four: building dashboards in Tableau or Power BI. Now you take everything that we've learned so far and put it into a professional business intelligence tool. Pick one; it could be Tableau or Power BI. It really doesn't matter. If you want to know where the market is heading, Power BI has officially overtaken Tableau. It now appears in 29% of job postings compared to Tableau at 26%, and is growing faster due to the corporate adoption of the Microsoft ecosystem. But honestly, either one works. There's still plenty of jobs for either one. The principles are the same. What matters is your ability to build dashboards that tell a story. This month you need to learn about connecting data sources, data modeling basics, building visualizations, creating calculated fields and dashboard designs. Then you need to do filters and parameters. But here's where people struggle. They want to learn the tool, but then they don't apply the storytelling principles from month 2. So they build dashboards that look like canvases of random charts thrown together. That is not a dashboard. That is a data dump. A real dashboard answers one business question, is intuitive, and it highlights what matters most, and it guides the viewer's eyes to the insight without having them to hunt for it. I tell my students this all the time. If you're still making dashboards that look cluttered and confusing, do not move on to the next step. There's more to learn and you're not ready yet. By the end of month 4, you should be able to at least build 2 polished dashboards that you'd be proud to show a hiring manager. If your dashboard still looks very cluttered and confusing, go back to month 2. You're not ready to move on to the next step. Okay. Month 5, creating your portfolio and building your brand. Now that you have the skills, month 5 is all about packaging them so the world can see you. This month has 3 parts: your portfolio, your resume, and LinkedIn. Part 1: Build your portfolio. Here is a stat that should change how you think about this. A recent survey of hiring managers found that 84% are willing to hire a candidate without a relevant degree if they have a portfolio demonstrating the exact technical skills for the job. 84%. So your portfolio can literally replace a graduate degree or a certificate in the eyes of most hiring managers. Your portfolio should have 3 to 4 polished portfolio projects that solve real business problems. Not Netflix dashboards, not COVID dashboards, not the same Titanic survival analysis that every beginner builds. Here's how you create standout projects. First, identify high-value problems in your target industry. If you're going into healthcare, for example, what keeps healthcare executives up at night? If you're targeting e-commerce, what are the biggest challenges in that space? Research industry blogs, Reddit, LinkedIn posts, Use AI tools like ChatGPT or Perplexity Deep Research to find common pain points, and then find real-world datasets relative to those problems. Each project should have 2 deliverables, a dashboard that answers a core business question, and a consulting-style slide deck that presents your insights and recommendations. For the slide deck, remember to learn the Pareto principle. Lead with the answer first and then support it with key insights and structure everything to drive a decision. Every slide should have an action title at the top, not sales by region. That tells me nothing. Instead, West Coast sales dropped 15% due to a supply chain delay. That's an action title. But here's why this matters for your paycheck. Studies have found that hybrid roles requiring both analysis and presentation skills offer a salary premium of over $15,000 over roles that just require technical analysis. $15,000 more just because you can present your findings clearly. You can host your portfolio in Notion, Canva, or a simple website. It doesn't have to be fancy. It just needs to be easy to access and easy to understand. Part 2, fix your resume. The biggest problem I see is people listing tasks instead of impact. There's a difference between creating dashboards using Tableau and built executive dashboards that reduce weekly reporting time by 40%. One tells me what you did and the other tells me why it mattered. Every single bullet needs to answer the question, so what? If it doesn't have a result attached to it, it's just a task and no one cares about tasks. Put your skills at the top, not the bottom. If you have work experience, Put that before your projects. If you lead with your projects, it can make you look junior and your experience matters more. Part 3, optimize your LinkedIn. Now this is critical, and I know most people don't like LinkedIn or social media, but 87% of recruiters use LinkedIn to vet candidates, but they only spend an average about 7 seconds on your profile before deciding to leave. 7 seconds. And if analyst isn't on your headline, you can fail the 7-second test easily. Your headline should communicate value. Your banner should reinforce your brand, and your summary should tell your story. Your featured section should also showcase your portfolio. Portfolio projects, or even your resume. By the end of month 5, you should have a complete portfolio with 3 to 4 projects and a polished resume and a LinkedIn profile that passes a 7-second test. Okay, month 6, get real experience and craft your story. This is the final month, and this is where you can separate yourself from everyone else in the job market. Part 1, create your own experience. Most people get stuck here. They say, I don't have experience. How am I supposed to get hired without experience? Number 1, stop waiting for someone to give you experience. And I'm gonna teach you how to create your own. Here's something that most of us don't realize. There are thousands of online creator-based businesses that are drowning in data that they don't even know how to use. YouTubers, course creators, coaches, e-commerce store owners, newsletter writers, and more. These people are generating revenue, running ads, tracking subscribers, and managing customers every single day. But most of them have no idea how to analyze any of their data. So that's where you can come in. You can reach out to some of your favorite midsize or small creators, offer them 30 days of free analytics support. Tell them that you can help them understand their audience data, track their marketing performance, or optimize their sales funnel. Out of every 10 or so outreach attempts, at least one will say yes. Why? Because they need the help and no one else is offering. So treat this like a paid consulting project from day one. Set up a kickoff call, ask smart questions, get their messy data, clean it, analyze it, and build a dashboard and slide deck with recommendations. Deliver that value in 30 days or less, and then you walk away with a polished case study, a resume bullet point that actually matter, a testimonial, and stories that you can tell in your interviews. You can use a title as analytics consultant on your resume. That's not fake. That's real work with real impact. Now, part 2, craft your story. 57% of employers say a candidate's personal pitch makes them stand out during the hiring process. So your story is the most powerful asset. Using the STAR method— situation, task, action, result— write down your top experiences and translate them into analytical narratives. If you are a teacher, for example, you analyze student data to improve outcomes. If you worked in retail, you track sale trends to optimize inventory. If you worked in HR, for example, you identify turnover patterns to boost retention. Every experience can become an analytics data story if you know how to frame it. So you need an elevator pitch. If I ask you, why should I hire you for this role? You should be able to answer it in 30 seconds or less. So really sit down today and really think about what you bring to the table and what value can you provide on day one. And what high-impact experiences do you have? By the end of month 6, you should have a real consulting experience on your resume, a clear story you can tell in any interview, and the confidence to start applying. Now, I know some of you're thinking, this sounds good, but does this actually work? Let me tell you that I've seen this with my own eyes. Since 2022, I've helped thousands of other career changers become data analysts without going back to school. Truck drivers become process analysts, teachers become finance analysts, warehouse workers landing roles at Fortune 500 companies. They didn't do that by going into $40 grand of debt for a master's degree. They did it by following a practical roadmap, building real skills, and creating proof that they can do the job. The traditional route has majority of graduates underemployed within a year. The practical path has people landing roles in 3 to 6 months. If you're serious about making this transition yourself and you want help building your roadmap, click the link in the description to book your free career strategy session. Now that you understand the path that actually works, there's one more piece that you need to get right, because having the skills and the strategy only matters if you can prove it in your portfolio. And in my next video, I'm going to walk you through exactly how to build a portfolio project that will get you hired in today's job market. Not the generic projects that everyone else is doing, but the projects that hiring managers stop and pay attention to. Click here to watch now.
More from Kedeisha




Data Analyst Portfolio Project with AI | NBA Championship Prediction Model (End-to-End Project)





