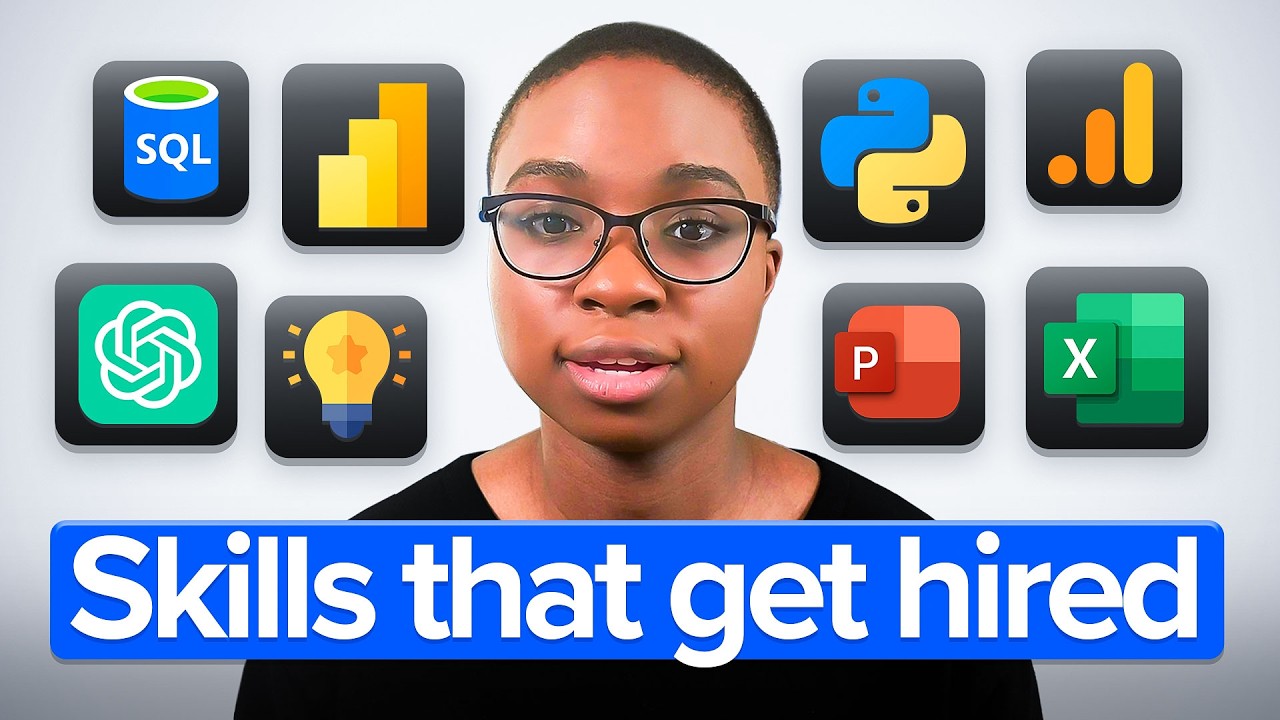
In this video Kedeisha Bryan argues that the traditional data‑analyst playbook—learning SQL, Python, Tableau and building generic tutorial projects—no longer lands jobs. She explains that while demand for analysts is growing (23% projected through 2032), employers now value a different set of capabilities. She ranks eight skills that matter in 2026, from least to most critical: (8) Python as an automation accelerator, (7) PowerPoint for persuasive presentation, (6) Excel as a deep‑analysis platform, (5) Dashboarding with Tableau or Power BI (focused on strategic, agentic BI), (4) AI fluency and the copilot mindset, (3) Domain specialization (T‑shaped expertise), (2) Advanced SQL (joins, window functions, modern data‑pipeline tools), and (1) Data storytelling and business thinking, which she claims AI cannot replace. Throughout she backs each point with industry statistics, real‑world examples (e.g., McLaren racing, NASA, Target, sports analytics), and emphasizes that the differentiator is strategy, communication, and domain knowledge rather than raw technical certificates. She also promotes a free training program to help career‑changers acquire these skills efficiently.
Chapters
Everyone online is telling you the exact same thing. Learn SQL, learn Python, learn Tableau, build some projects, and boom, you'll get a data analyst job. But if it was that easy, why are there thousands of people with those exact same skills still unemployed? Because the game has changed and most people did not get the memo. AI didn't kill data analyst jobs, it just killed the old playbook. And today I'm gonna give you the new one. The only 8 skills that matter this year, ranked from good to know to you're unemployable without this. So you've been lied to about what it takes to become a data analyst. Every course, bootcamp, every LinkedIn, YouTube guru telling you the exact same things. Most are teaching from the same playbook that worked in the 2020 boom. And so if you're still learning from the same skills that worked in the 2020 boom, grinding through the Google certificates, building the same tutorial dashboards that every recruiter has seen 1,000 times, then yes, you should be worried. But not because the jobs are gone. The Bureau of Labor Statistics projects about 23% growth in data analytics roles through 2032. So the jobs are clearly there. The average salaries are great. The money's there. What's changed is what qualified actually means, and most people are still operating from the old definition of what qualified means. So today I'm ranking from number 8 all the way to number 1, the only skills that actually matter if you wanna land a data analyst role this year. And if the skill that you've been spending all your time on doesn't make the list, that's a conversation that you need to have with yourself. Now stick with me because number 1 is the one skill that AI literally can't replace and almost nobody is talking about it. Now, if this is your first time here, I'm Kedisha, and about 6 years ago I was delivering pizzas and Amazon packages. And today I'm running a community of over 60,000 current and aspiring data professionals. I've helped thousands of career changers break into data analytics without going back to school and wasting money on courses that just don't work. I've watched this career transform in real time, and my only goal is to help you cut through all the noise and endless information to get you exactly where you want to be in the least amount of time. Okay, so starting off with number 8, Python. Now before you attack me in the comments, Python is a great skill. We teach it in my program, but here's reality: most entry-level analyst roles don't really require Python. They require SQL, Excel, the ability to think clearly about business problems, data storytelling, visualization. Where Python earns its spot on this list is as an accelerator. Once you've nailed down the fundamentals, Python is what lets you automate the grunt work, data cleaning, repetitive reports, pulling data from APIs. That is where Python shines. You've probably heard the same age-old statistics. Data practitioners spend about 80% of their time finding, cleaning, and organizing data. That only leaves about 20% for actual analysis. Python used correctly can help you flip that ratio. And when you flip that ratio, you stop being a report junkie And start being a strategic asset. And if you wanna see what this looks like at scale, look at Formula 1 racing. McLaren Racing uses Python-driven automation to process over 11 billion data points from 300 telemetry sensors on each car. They run 300 million race simulations trackside to predict tire degradation and optimize fuel strategy in near real time. That's Python doing what Python does best, taking the grunt work off the table so the strategist can focus on winning. For you as an analyst, the principle is the same. Instead of manually updating weekly daily sales spreadsheets, you deploy scripts that monitor data and flag changes automatically. That's operational efficiency gains of up to 80%. So don't just make Python the first thing that you learn. Master the tools that get you hired first and then add Python to become dangerous. Okay, number 7, and I already know some of you are probably rolling your eyes— PowerPoint. Yes, PowerPoint, the tool everyone overlooks because it's not technical enough. Let me tell you something from experience: a good deck wins deals, wins promotions, and wins projects. Here's the thing— not everything you do as an analyst will live in a Dashboard or a spreadsheet. Sometimes you're going to have to walk into a room or a Zoom call and present your findings in a way that makes someone makes a decision. And if your slides look like copy and paste charts with no structure, no story, you're going to get skipped over fast. And this isn't hypothetical. Big data communication costs real money. NASA lost the Mars Climate Orbiter, a $125 million mission, because two engineering teams were using different units of measurement and nobody caught the disconnect in their reporting. Target lost over two billion expanding into Canada because. Of pricing and inventory data that was communicated so poorly it led to empty shelves and destroyed customer trust. JP Morgan got hit with a $350 million fine over incomplete trading data capture. So these aren't just coding failures, these are communication failures. The last mile of analytics, the presentation of findings, is where the value is either realized or destroyed. The analysts who get promoted are not the ones with the fanciest SQL queries or who know the most tools. They're the ones who can stand in front of any manager or anyone in the company and make the insight feel inevitable. That is consulting-style storytelling. One chart, one insight, one action per slide. AI cannot walk into any meeting and sell a recommendation. You can, and that is your edge. All right, number 6, the OG itself, Excel. Look, I know Excel is not sexy, but Excel shows up in over 70% of job openings I analyze. 7 out of 10. It's still the first tool a lot of companies still use. But here's the thing now, basic Excel is table stakes now. Everybody can make a pivot table, and if you can't, listen, that's a problem. What separates you is now Power Query or just heavy data cleaning in Excel, proper data modeling, and the ability to use Excel not as a calculator, but as an insight extraction machine. And if you think of Excel as just a spreadsheet tool, let me put some respect on its name. There is literally a Microsoft Excel World Championship. It's aired on ESPN. They've got data athletes with nicknames like the Annihilator solving complex logic puzzles under time pressure. That is how deep this tool goes. When I first started learning Excel was my gateway. I learned pivot tables, conditional formatting, lookup functions, basic statistics, and honestly, that foundation made everything else click faster. SQL join logic made more sense because I understood data relationships in Excel first. Data visualization and Tableau, same thing. Excel is a skill that compounds into every other skill on this list. So no, you don't skip Excel. You master it and then build on top of it. Okay. Number 5, dashboarding with Tableau or Power BI. These tools showed up in about 60% of job postings that I analyzed. And here's the deal. Just pick one. There's more than enough jobs for either. Don't waste time learning both at the same time. Get good at one and then you can go to the next one. But here's the thing where most people mess up. They build dashboards that are basically a canvas of random charts. No story, no flow, no business question being answered. And let me be honest with you, if your portfolio still has dashboards that look like that, you're just not ready yet. This year, the shift is to stop just building charts and start designing strategic making tools. We're moving into what the industry is calling agentic BI, where tools like Power BI Copilot and Tableau Pulse automatically detect anomalies and summarize key drivers in natural language and recommend next steps. That is the direction everything is moving towards too, and your dashboard needs to keep up. If you want an example of how great data visualization looks like, study Kirk Goldsberry. He is an NBA analyst who converted thousands of rows of spatial shooting data into hexagonal heat maps that literally changed how basketball is played today. He proved that the mid-range jump shot was statistically inefficient compared to 3-pointers and rim finishes, and that insight has reshaped how teams recruit and how the game is coached today. One visualization, league-wide impact. And that's the standard today. A great dashboard or report should make the insight feel inevitable. It should answer a real business question, guide the viewer's eyes to the answer, and make someone say, okay, I know exactly what to do next. Okay, now before I get to the top 4, and trust me, this is where it gets real, let me say something to you directly. If you're watching this video and you're thinking, listen, I've been learning for months and I'm still not where I want to be, it's probably not a skill problem, it's probably a strategy problem. And that's why I created a free training that walks you through how I help career changers go from stuck to hired without going back to school, without wasting more on stacking certificates and applying to 3,000 jobs and not hearing anything back. The link is in the description, it's free. Go watch after this video because what I'm about to share in the next 4 skills, that is the step that separates 6-figure analysts from everyone else stuck in the tutorial loop. All right, so let's keep going. Okay, number four: AI fluency. And this is where I need to give you some tough love. So AI did not take your job; it's not coming for your job. It just exposed that maybe you were just learning tools and not thinking well enough. And the numbers are stark: 44% of organizations are already piloting generative AI. But here's what's wild: only 9% have actually reached real AI maturity. That means there's a massive gap between companies experimenting with AI and companies actually knowing how to use it. And that gap is where you come in—professionals with AI literacy skills and a the job market, they're commanding a 40 to 69% wage premium over the baseline. Organizations with structured AI upskilling programs are nearly twice as likely to report significant ROI from AI, 42% versus just 21%. The money follows the people who understand this technology, not the people who are afraid of it. But here's the dirty secret that no one wants to talk about when it comes to AI. Even in the professional settings, 98% of people still have to edit their AI-generated outputs. Honestly, I think that number's too low. To me, I think it's 100%. AI hallucinates. It makes mistakes and it will confidently walk you to the wrong answer and you have to be the one to check it to make sure it's right or not. So the real power isn't getting AI to talk anymore, it's getting AI to think with you, not for you. You are the pilot, AI is a copilot. I say this all the time. The CEO of Microsoft uses AI the exact way. He synthesizes thousands of his emails, project templates, and meeting transcripts into structured intelligence. He's not replacing his thinking, he is automating the mental overhead so he can focus on decisions that actually matter. The analysts who master this principle, they're literally automating 50% of their routine work and using that extra time to focus on strategy insights and the stuff that gets them promoted and moves the needle. So the ones who are just relying on AI blindly and just vibe coding blindly, they're going to crash. Okay, number three, and this is where most people are getting it wrong: they stay generalists. They can probably analyze data from any industry, but they don't actually understand the industry they're analyzing. That's the problem because AI can already handle a lot of surface level analysis. What it cannot do is apply deep domain knowledge and business context, and that's where you win. Think about Moneyball, and I love this story, and I've said this in other videos before. Billy Beane and the Oakland A's didn't win just because they had data. Everybody had data. They won because they applied sabermetrics, a domain-specific analytical framework, to exploit an inefficiency that every other team was ignoring. Traditional scouts were just evaluating players based off of batting average and just what they looked like. Beane's team realized that on-base percentage was far more predictive of winning. That wasn't a math insight, that was just a business insight of using their domain knowledge. They understood the domain deeply enough to see what the generalists couldn't. Same thing applies today. A marketing analyst who could understand conversion funnels, the nonlinear customer journey today, campaign attribution, will always outperform a generalist who just knows the tools. A healthcare analyst who understands HIPAA laws, clinical workflows, patient privacy laws will always bring more value than someone who doesn't. And the data backs this up. Analysts who develop deep expertise in high-growth sectors such as healthcare, fintech, or e-commerce can see a 76% increase in compensation from entry-level to senior. And that is a nuance no one wants to talk about. Pure specialists can sometimes become myopic, losing sight of the bigger picture. That's why you need what's called a T-shaped skill set— deep expertise in one area With broad enough skillset to see the forest through the trees. So pick a lane— finance, marketing, healthcare, supply chain, whatever it is. Study it. Learn the key metrics to industry tools, business language people actually use in the field, because in the next wave of hiring, companies don't care to ask, hey, can you just use SQL? Do you know joins, et cetera? They would wanna know how can you use data to solve their business problems. Quick pause. Now, if you want to land your first job in data analytics and avoid the lengthy mistakes that I did, click the link in the pinned comment where you find the exact steps that my students use to land their job in data analytics without going back to school. All right, now let's get back to it. Okay, number 2, SQL, the king and queen of data analytics and the gatekeeper. SQL appeared in over 76% of the job postings I looked at, and I'm not talking about basic SELECT statements. I'm talking about JOINs, window functions, CTEs, subqueries, the stuff that you actually work with on real business data on the job. And here's a difference today between analysts who survive and analysts who thrive. Speed and automation. Remember that stat I mentioned earlier, that 80% of an analyst's time goes to finding, cleaning, and organizing data? Well, the old way was just, you know, writing pure manual queries, spending hours joining data, running the same reports week after week like a hamster on a wheel. The new way is using the modern data transformation tools like dbt, Snowflake to create reliable governed datasets that serve as the foundation of the entire enterprise. Companies are implementing this kind of workflow automation and are seeing near 200% ROI within their first It's not a cost center anymore. It's a strategic asset. Let's see what this looks like at the highest level. Let's look at professional sports. I love sports, so I love using stories from sports, but a single Premier League match, for those who are not soccer fans, that is a big soccer league, produces 3,000 to 4,000 event logs, passes, shots, tackles, plus millions of frames of professional tracking data. Technical directors at teams like Newcastle United use automated SQL pipelines to turn that raw match data into next morning tactical insights for their coaches. That's data informing transfer markets. market decisions worth tens of millions of dollars. You don't need to become a data engineer, but you need to know how to make your workflow smarter because this year efficiency is a requirement, not a bonus anymore. Okay, at number 1, the skill AI cannot replace: data storytelling and business thinking. Let's get one thing straight. Your charts and dashboards don't mean anything if you can't explain why they matter. AI can generate graphs, it can summarize trends, it can even spit out insights faster than you could ever think of. But you know what it cannot do? It cannot tell a story that influences a business decision. And that is what makes storytelling your competitive edge. And it's backed by research. Facts wrapped in a story is 22 times more likely to be remembered than data alone. Data-driven stories boost audience engagement by over 300%. Storytelling has been shown to improve conversion rates by over 30% and increase perceived value by over 2,000%. And here's Here's the kicker. 92% of senior leaders say storytelling is effective, and 71% of those same folks prioritize it for C-suite reporting. So think about it. All companies today, they're just drowning in data. They've got dashboards, reports, et cetera. But what they don't have enough of is people who can translate all those metrics into decisions that executives can act on repeatedly. Organizations that are highly data-driven are 3 times more likely to report significant improvements in decision-making, but around 70% of leaders report a skill gap in their workforce. So they're not lacking data. Data's They're lacking people who can think critically, contextualize findings, and communicate persuasively. Brent Dykes, one of the leading authorities in data storytelling, calls this the last mile problem. He describes a real moment in a boardroom where a senior VP looked at a hard-won analytical insight and dismissed it as nonsense simply because it wasn't communicated persuasively. Months of work gone, not because the analysis was wrong, because the story just wasn't there. And here's what I mean. Instead of saying, hey, sales dropped 10%, you can say sales dropped 10% because we lost track with our high-value customer segment. And here's a 3-step plan to fix it. You see the difference? One is about reporting and the other is about impact. And I see this time to time from people I've coached from over the years. The ones who master storytelling are the ones who end up with the jobs. They're the ones who get tapped for promotions while everyone else are just grinding their teeth through dashboards that no one ever looks at. If you wanna stand out, double down on data storytelling. Learn how to build persuasive narratives with your data. Practice presenting like a consultant, not just a reporter, because analysts who can make people care about the numbers, those are the ones who will always have a seat at the table. Okay, so there you have it, the 8 skills that matter this year. Not the basic stuff everyone else is learning, not the outdated tutorials from 2020, the real skills that separate 6-figure analysts from everyone else. And notice what I didn't say. I didn't say collect more certificates. I didn't say take another boot camp. I didn't say take more courses, because proof is the Not credentials, not certificates. Proof. The data analyst of this era is not a reporter of facts. You are an architect of outcomes. You're learning to become valuable, and when you become valuable, the jobs will just come. Because Nvidia CEO said the same thing: the most valuable skill going forward won't be coding, it will be communicating. And that's exactly what this list has been building to. If you're serious about mastering these skills with real projects, real mentorship, and real feedback, I've got a free training in the description that shows you exactly how we do it inside my program. No fluff, no pitch, just the roadmap. Because look, you can do the same thing everyone else is doing, taking the same courses, building the same projects, applying to the same jobs, or you can do something completely different. You can focus on the skills that actually matter, ignore everything else, and build projects that actually stand out and position yourselves for roles that actually pay. The choice is yours, but while you're still thinking about it, someone else with less talent and less experience than you is already making moves. Don't let that joker take your spot. I'll see you in the next one.
More from Kedeisha




Data Analyst Portfolio Project with AI | NBA Championship Prediction Model (End-to-End Project)





