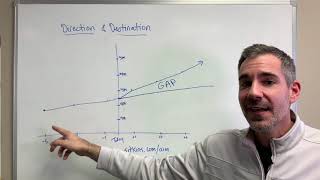
Brent Kelly (Sitkins Group) presents a short coaching video showing agency leaders how to test whether their current direction will reach their desired destination. He uses a simple X–Y chart (time across the X-axis: -5y, -3y, -1y, now, +1y, +3y, +5y; revenue on the Y-axis) and a made-up sample agency at $2.5M today (5y: $2.0M; 3y: $2.2M; 1y: $2.4M) to illustrate how past trends project future results and reveal the gap between current trajectory and aspirational goals. He emphasizes changing habits/strategies to close the gap and closes with a promotion for Sitkins Network’s all-inclusive membership ($497/month, aiming for 100 members).
Questions this video answers
January 8, 2021.
$2.5 million.
Five years ago: $2.0M; three years ago: $2.2M; one year ago: $2.4M.
A range of $1M–$5M (he uses 1 through 5 million with the sample at $2.5M).
-5 years, -3 years, -1 year, now, +1 year, +3 years, +5 years.
Chapters
Hi, Brent Kelly here of the Sitkins Group with my profit tip Professional fitness. To help you and your agency gain clarity, consistency, and to make a commitment to become your best version possible. And I want to share with you today a very simple yet powerful chart to help you as an agency leader. Say, you know, are the current things that we're doing or have been doing, is that going to help us get to where ultimately want to go? Now, before I get into this, just a basic, easy example. I love roadmaps. Of course, now they're all digital on Google or Apple Maps or whatever. But growing up, I love to look at atlases and roadmaps. And if we were going on a trip, I would say, okay, where are we going? What's the route to get there? And I would look at different ways of getting there. But just ask yourself a question. As an agency, if you had an idea in mind where you wanted to go and you had no roadmap or the map wasn't leading you there, does that make any sense? Well, of course the answer is no. Or what if you had a roadmap, but you didn't really know where you wanted to go? So this is the idea of, does your current direction match your ultimate destination? Of course, you need to know both. You need to know where it is you want to go, then you have to figure out how you're going to get there. And so again, this is just an idea, an example, a chart to help you just kind of think about past results can be an indicator of future results. If we don't change habits or strategies or behaviors. Right. If we do the things we've always done, we're going to get what we've always got. And this idea actually came from Andy Stanley, who talked about, does your current direction match your destination? So here's what I want to do. And this is something you can do on your own blank sheet of paper. Pretty simple to do. We like to keep things simple, but on the x axis, it's just the time, right? So you look back five years, back three years, back one year. This is as of today, where they meet, plus one year, plus three year, plus five years. And then on the Y axis, I want to look at revenue results. So in this example, I'm just going to use a sample agency. I'm making these numbers up just to give you an idea, but let's use an agency that's $2.5 million in revenue. You may be way bigger, you may be smaller, but I just want to give you an idea. Of how you can do this, very, very easy. And you're going to have different revenue numbers so you can chart it for your own graph. In this case, I use one through five million in revenue, currently at two and a half. So just splitting the difference. So in this sample agency, you, you look back five years, three years, one year. So five years ago they were about a 2 million dollar agency. Then they went to about 2.2, then about 2.4 one year ago, and they're at 2.5 million in revenue today. Okay. So this just kind of gives us a trajectory of where we're going now. Again, I know there are outlier years, certainly last year was different. But you just look at it again. It can be a very good indicator of where we're going. Especially as I've already mentioned, if we don't change behavior, strategies, habits of any kind, we don't change the culture, our people, it's going to be very similar. We see it all the time in tracking agencies. So if you take an agency like this, they're going to track out, if you follow the model, something like this. Right. So they're going to grow very slowly and steadily and maybe that's okay. But it's always interesting because as I talk to agencies many times, especially for the first or second conversation, and they're learning about our programs and what we're doing, I say, well, you know, what do you really want? Well, I really can see us being a, you know, a $3 million agency next year. Great. That's a pretty big jump. How are you going to do that? Well, I don't know yet, but we're going to be a three million dollar agency. What could you be in three years? And I always ask the question, looking back, you know, how did you get there? Well, you know, I think in three years we could be a 3.5 million dollar agency. Again, I'm using a sample here. And then in five years, well, I don't know, that's a long time. Maybe 4 million. Right. So they have these ideas of where it is they want to go. But if you look at it and you start from today to go from 2.5 million to this, 4 million is going to look more like this. Right? That's going to be the trajectory you're going to have to go on to get there. Well, we're not on this trajectory. So this is simply the gap. This is the gap that most agencies face. And I think as you do this, I want you to think about where is it that you really Want to go one year, three year, five years? You've got to have an idea in mind. You've got to have some goals. Doesn't mean they're always going to be perfect. But you've got to have something that you can rally your team around, rally yourself around and then say, wait a second, is our current trajectory going to get us there? And maybe it will. Maybe you're on the right track. Good for you. But for most agencies, they realize they have to be honest with themselves. Remember, all progress starts by telling the truth. By telling the truth. I had a finance person I was meeting with a few years ago and we were talking about debt and I said, what's the best way for people to get out of debt? What does it look like? And I said, is it lowering interest rate? Is it that snowball effect? Is it organizing your debts differently? And he said, it's pretty simple. Brent. The best way to get out of debt is to stop borrowing money. That's the best way to get out of debt. Stop doing the same mistakes you've been doing. What we see with agencies is they continue to do the same things, yet they expect a different result. We all know that is the definition of insanity. So GAAP to me is this. What are your goals and what are your plans? What are your goals and what are your plans for the future? And does it match again? Does your direction align with your ultimate destination? Now I also want to share with you that we just launched the end of last year going into 2021, our all inclusive model for the Sitkins Network. Access to every one of our world class training programs, our tools and resources. We have a peer community, we, we have monthly masterminds, all of these things for every single member of your agency team. All live, all virtual stuff that you can attend from the convenience of your home or your office, wherever you may be, to fill that gap, to get you to where you want to go. And as coaches and trainers, we're going to work with you to help you do that. And if you just go to sitkins.com ain that stands for all inclusive model, you'll learn about all the programs and what we're doing and get signed up. I can tell you until we get 100 members and we are on the way to get there, we're going to have 100 members very soon in this program, it's $497 a month. All of our programs, all of our training for 497amonth, which just for our producer camp, which starts in a couple weeks. That's half the price of just the one producer camp. So this is an incredible opportunity. My mission, our mission at Sitkins is to help as many agencies become the best version possible. We. We want you to fill your gaps. We want you to get great results. We want you to be part of this program so you can take your business to the next level. I wish you all the best in your success.