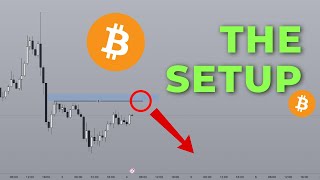
A single-speaker YouTube market commentary (The Art Of Crypto) focused on bearish Bitcoin technicals ahead of a monthly US non‑farm payrolls release. The presenter reviews weekly/daily structure, identifies bearish order blocks and fair value gaps, outlines two shorting scenarios (short into relatively equal highs vs. trading lower if a new bearish order block forms), and promotes a free macro masterclass taking place that day.
Chapters
Good morning guys. So the scenario that we discussed in yesterday's video pretty much came to fruition, although now you have left relatively equal highs back there, which means that today the setup is going to be very obvious. Also today we have non farm payrolls, which is probably the most volatile news event in all of crypto in, well, not all of crypto, all of finance, pretty much outside of President Trump announcing his tariffs and perhaps fomc, perhaps interest rates, non farm payroll is basically up there in terms of the a tier of news events and that is today and it usually happens once a month. And so today is probably going to be a very volatile day and I'm going to give you guys the exact setup to take advantage of this. But before I go into it, non front payrolls, FOMC, interest rates, President Trump's tariffs, all of these are macro events. If you don't really know how all of these work and how you can apply it to crypto, then you're in luck because tonight at 2pm GMT, I'm going to be hosting a free macro masterclass. Inside you have 150 slides teaching you all you need to know about macro. You're going to have six bonus items. Basically what I'm trying to say is that this is going to be a really valuable masterclass. It's going to teach you everything you need to know about macro. The link to sign up will be in the description box below. It is absolutely free. So if you're not joining, you're missing out. But without any further ado, let's dive into the video. So taking a look at the weekly again, we are still playing out that weekly profile where we had a liquidity sweep above this week's high but we failed to close above and we closed below instead. This signals a lack of interested buys to keep the price above this level. And so because of that, the vias for this week was to look for any cells above the weekly open so that we can sell it to underneath the weekly open. And so far that has been playing out right. You did come all the way almost to the previous weekly high, but you didn't break above it. And at the moment you are still heading down. So the weekly bias remains unchanged. It is still going down in terms of the daily. Just taking a look at the order flow. You have bearish order flow basically since you know the start of January or like the middle of January in this case. And right now this remains the bearish order block that needs to get broken in order for you to Be able to go like, hey, without a shadow of a doubt. Bitcoin is now bullish. And until that happens, it's going to be much more likely for bitcoin to just have continuations towards the downside. Just to give you an example of what happens every time you tap into a bearish order block, for example, right here, you trade above, but boom, you go down, right, because you failed break above the order block, which now validates that as the order block price trades, trade trade trades just, you know, taps into it multiple times, fails, and boom, off you go. Same thing here at the moment. So this is the order block. Price has tapped into it pretty much for this entire duration and even here, but so far it has not yet shown any signs that it wants to break above. So history doesn't often repeat, but it rhymes. And taking a look at just how it, it has played out since the middle of January, wouldn't be surprising to see prices, you know, head lower from here and at least until not until these highs are taken. Now, in yesterday's video, we talked about how the bitcoin futures on the CME has already had all of these highs swept. And on your major crypto exchanges, in this case, we're looking at the Binance USDT perpetual chart. The high has not yet been swept. And with how much institutional involvement there is in crypto nowadays with BlackRock and, you know, all of these other ETFs, then we take a look at the CME, because that holds weight. It's just like how the CME gap holds a lot of weight even compared to a regular fab gap that you can see from just any random crypto exchange. As of right now, all of the signs point towards a bearish setup. And so that now that we have our understanding of the higher time frame, start to go into the lower time frame to see what areas that we can find to support our theory that it is indeed going to go down. And so first of all, I am going to remove all of these drawings because we don't need them anymore. So taking a look at a one hour, this is the key, you know, order block that led to the break in market structure. So take a look here. This is a break in market structure. This is the order block that led to that. And so eventually, I think if you retrace back into this order block, it is going to provide you a really solid opportunity in order to get into the market for a short. Now, the beautiful thing about what happened yesterday is that, yes, we did anticipate yesterday to be a bullish day. We did anticipate New York specifically to be a bearish continuation, and it did happen, but it left behind these relatively equal highs. And right now, as of the time that I'm recording this, this is the Asian session, we have the entirety of London and the New York ahead of us. And chances are, if you return back to these relatively equal highs here, this is going to be the setup that you want to look for. Just to go back onto, let's say the four hourly chart to refine this order block down into a smaller PDOA that we can take advantage of with potentially higher risk to reward, because let's face it, that order block is huge. If you were to place a stop loss all the way at that wick high there, you would be very hard pressed to get a good risk to reward out of your trade. But if we refine it down now to a four hourly fair value gap, then these relatively evil highs are sitting right before a four hourly fair value gap. And so today, if you do sweep out these highs, then that is going to be the high of the day and you're going to just expand lower. Now why do I say now? Why am I looking for this setup in particular? It has to do with the concept of weak highs and strong highs highs. Basically, when you are shorting, you want to ideally be shorting into strong highs. And this is the exact setup that you saw on CME where all of these previous relatively equal highs have already been swept out, right? So a strong high is a high that sweeps liquidity. Once you have swept the liquidity, it means that there is no longer a reason for the market makers to want to revisit this area, at least in the short term. But when you have relatively equal highs, that is a draw on liquidity. It's a level that acts to trick a lot of retail traders, especially people that do not understand how smart money trading works. For them, it's to trick them into thinking that, oh, it's strong in resistance or whatever, and then they're going to start shorting and then price more often than not is going to sweep them out before giving you the real move. If you've ever been in a situation where you read the direction correct, but somehow some way the market just kind of stopped you out, like just barely stopped you out, and then it moved into your direction, this is probably what's happening. It's because you're trading into weak lows, slash weak highs. So ideally we want to be taking a short at a strong high in this case these are relatively equal highs. And there is one like scenario that would invalidate this theory. But for now that's the ideal scenario that we're going to look at. That is going to be a strong high and then chances are very likely you're going to break market structure, you're going to break order flow and you're going to head down from there. So early on I discussed one scenario that would just completely invalidate the one that I just discussed and that has to do with this order block right here that has formed. So right now during the Asia session, Price has retraced into the order block. In fact, I think the Asia session is almost about to be over. So this is 11pm The Asia kill zone ends at 12am so depending on how London reacts again, if London starts shooting up then that's a really good sign. But if London just starts tanking right away, then the scenario that you want to look at is going to be for this series of up close candles to become the new bearish order block and you're just going to trade it lower, targeting the previous daily low. But honestly you're going to, you have so many more levels that you can look at when it comes to this down move just because of how much liquidity there is. For example, right here at 81,000. Didn't quite tap into it yesterday. Do apologize for how close I am to the screen not wearing my spectacles at the moment. Like all these levels that I'm drawing right now are valid TP points. I'm not saying that they're all going to get hit today, but as price goes down, feel free to take, you know, profits. And so right now I have given you the two scenarios to prepare yourself for what is going to happen for the rest of the day. Speaking about rest of the day guys, this macro masterclass is something that I am incredibly proud of and I believe something that will help you guys out a lot. This is kind of like a one stop shop for everything you need to know about macro. And if you want to just stop missing out on the generational entries when it comes to crypto because you don't know how to read macro or getting into the worst times in crypto because you don't know how to read macro, then this is a masterclass you do not want to miss. It is absolutely free. There's no fluff, no bs. For those of you who've attended past master classes before, you know this is full of value. Anyways. With that said, I'll see you in the next one. Bye. Bye.










