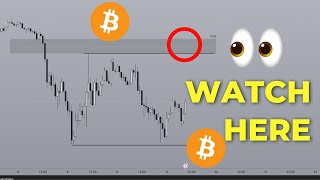
Presenter (The Art Of Crypto) frames April 9, 2025’s market day around the upcoming FOMC meeting minutes and elevated volatility (VIX). He compares current volatility spikes to March 2020 and August 2024, notes strong correlation between Bitcoin and risk-on equities (NASDAQ/S&P), and questions whether a V-shaped recovery is likely given different macro conditions. On Bitcoin he outlines technicals across timeframes: monthly uptrend intact but weekly bearish order blocks must be cleared for a bullish case; a sweep of lows showing lack of sellers would be bullish, while failure to close above highs signals weakness. He cites the CME Bitcoin futures high as already swept (bearish cue), describes a daily-range situation with relatively equal highs/lows acting as liquidity targets, and states he currently leans short until bullish confirmations occur. He also promotes a free macro masterclass replay available via the video description.
Chapters
What's up guys? Today is Wednesday. This is the day that we've been waiting for. Later at 2pm we're going to have the FOMC meeting minutes. And there is currently a lot of pressure on Jerome Powell to basically say the right things as well as talk about or just made the right moves. Because currently with, you know, whatever Trump is doing right now, it is, to put it mildly, crashing the stock markets of the entire world. And if you take a look at just the volatility index for traditional finance, this is called the vix, you can see that basically in the last five years there were three major spikes in terms of the volatility when it comes to traditional finance. This is stuff like the NASDAQ, the S&P 500, as well as just traditional stocks like the tech stocks, like the growth stocks. So the first time was during March of 2020, which is, as everyone knows, that was the COVID crash and everything basically did a flash crash and did a V shaped recovery right after. Second time that happened was in August of 2024 where everything also dropped in a flash crash fashion. But then you get a V shaped recovery. So are you going to get something similar this time around? Because again, in five years the volatility has never been this high except for two other occasions. And you can see this across the Nasdaq, this by the way, was August of 2024 where you went down by like 2000 points, but you recovered in the very next month. And taking a look back at 2020, you basically dropped from 9.7k to a 3000 point loss. But then again that marked the bottom. And back then the macro conditions were very different to what they are right now. So this begs the question, right? Given how correlated bitcoin is compared to the Nasdaq and the S&P 500, if they were to just God forbid, do a V shaped recovery, is Bitcoin going to also do a V shape recovery? One of the things that you guys need to understand on why you know, both of these back then, where they had V shaped recoveries as well as bitcoin, by the way, is for one, due to macro conditions back in 2020, everything was just back in quantitative easing, money was being printed all around, interest rates were really low. And this was a macro environment that really contributed to an increase in stock valuations when it comes to the NASDAQ, the S& P and you know, everything else in the world. And in 2024 it was also kind of a different situation because back then you were in a really strong uptrend. But if you just take a look at the Nasdaq, these are higher highs and higher lows. And in this kind of an environment, the flash crash, boom, like it would make sense. And currently, if you just take a look at the Nasdaq, this month is going to be very, very pivotal because if you do close below this low right here, this would mean that this is a confirmed lower low with a confirmed break in market structure. And this is not what you want to see if you want to see a recovery on Bitcoin. And so right now this month is super key. Today is probably also really important because fomc what Powell says and what Powell does is going to shape a lot of, you know, how the markets are going to react through the rest of the month. So overall, like can we accept a V shaped recovery? I don't know. Right this time around it's, it's a very, it's very hit or miss, it's hard to say. And so let's tie it back into bitcoin. Right. So bitcoin, if you take a look at the monthly chart, yes, you're overall still in an uptrend. So for if anything like with the volatility index, you know, about to die down and perhaps things are going to recover, then yeah, you know, perhaps you might get a V shape recovery. And let's just go onto the weekly chart to see if that kind of scenario is possible. And right now the scenario that would make this possible is that we would need to break above these two weekly candles right here because currently these are going to act as your bearish order block on the weekly chart. And until these, this block gets broken through and trades above where price comes back down to find it, as you know, to flip resistance into support, then this is not going to be exceptionally bullish yet in terms of a bullish scenario, we don't have it yet. But a good first step to take would be that if you sweep currently you have swept below these lows right here. And if you sweep below and you fail to close below, that signals a lack of willing sellers below this price. And that's something you want to see if you're bullish. It's the same exact scenario as to like previously, if you guys have been following me for the past, you know, four weeks or so, you would have known that I called a long publicly here for about 5 to 6r and it was after sweeping this low right here and then you get a candle close above, right. Essentially you do not close below the signal strength and boom, the next two to three weeks, you just went from, you know, 80K to close to 90K. And similarly, the signal that we use to start going short is after you sweep this previous high here, but then you fail to close above, this signals weakness in the market and boom, you start heading downwards. So a good first step would be to sweep these lows to show strength and then potentially step two, that's the one that we're going to be looking for. But until this is confirmed, I wouldn't, you know, lean towards longs. If anything, I'm going to lean towards shorts. Now, the other factor that kind of ties into this is also the fact that on the CME chart, this high here has already been swept. Just to show you what I mean, if I go onto the CME Bitcoin futures chart, you can see that that high right there was already taken out. Let me just zoom in. For those of you who might not be able to see it clearly right there, that high has already been swept, which, if you are like, in terms of everything that could be bearish, this is super bearish. And so just to tie back into what we were talking about before, we have reason to believe that, you know, this is going to be bearish continuation. And at the moment on the daily chart, we have formed, you know, a bearish order block right here, as well as a potential favor gap right here that we can use as resistance or like just some kind of a key area if Price were to return to either one of those levels. Currently, you're just hovering above this previous low. You haven't quite swept it yet. And so this makes it relatively equal lows, which means that this is going to act as a draw on liquidity. Now, the only problem with this is the fact that you also have relatively equal highs. Like the moment you hop onto a lower time frame, you can see that, yeah, okay, relatively equal lows right there. But here you have relatively equal highs. And so this leads me to believe that the play here is the fact that Bitcoin is currently in a range where there's a range low that's a range high. And depending on how Price reacts today, given the fact that we have news, means that, you know, if you do get a sweep above the highs, right, tapping out all of these relatively highs, filling in the further gap, that is going to give you the catalyst to take a short all the way down to range lows. Now, the flip side could be true. You might just get rejected off of this daily, you know, bearish Order block right here sometime during the New York session. As with the time that I'm recording this, it is the end of the London killzone. And so it's just about a couple of hours left until the New York open kill zone begins. And depending on how price you know, shapes up during that time, then you might have a valid setup to just take it to the range lows. Although the only caveat here is that if you were to take a trade here and if you place your stop loss here, this is again relatively equal highs. We usually trade into strong highs and strong lows. And relatively equal highs are considered a form of weak highs. A weak high, by the way, which is a high that hasn't swept liquidity for example here or the other example in this case would be relatively equal highs are also considered weak highs. Similarly, these are weak lows. And the only thing you need to understand about strong highs, weak highs, blah blah blah, is that weak highs tend to be taken out and strong highs tend to be protected. So this prior to forming relatively equal highs here, this is a protected high, right? It's unlikely that highs is going to sweep this high. But the fact that you have relatively equal lows here, plus the fact that you know, overall bearish is shaping up to be bearish, then yeah, you know these are going to be targeted. Do not get tricked into thinking that this is, you know, quote unquote support. This will be tapped out sooner or later. And speaking about sooner or later, people are going to come to realize that macro conditions need to line up in order for crypto and all of the risk on assets to perform the way they should. And I'm willing to bet that most of you don't actually know how to read macro or know enough about macro to use it to position yourselves really early at the start of the reversal. Good news is that just last week I have held a free macro masterclass. There are like 120 slides and five to six different bonuses and at the moment I'm keeping the replay up for a few more days. If you guys are interested in getting access to the replay then click on the first link in the description box below. The moment you put your email, we're going to send you a welcome email and you're going to get the replay of the macro masterclass there alongside a couple of other bonuses that we've packaged up. All of this for free by the way. You don't need to pay. But anyways guys, if you watch until this point so far and you appreciate an analysis from the smart money perspective on Plato. Then make sure you click the subscribe button and stay tuned for more because I'll be coming with daily uploads moving forward. Cheers.