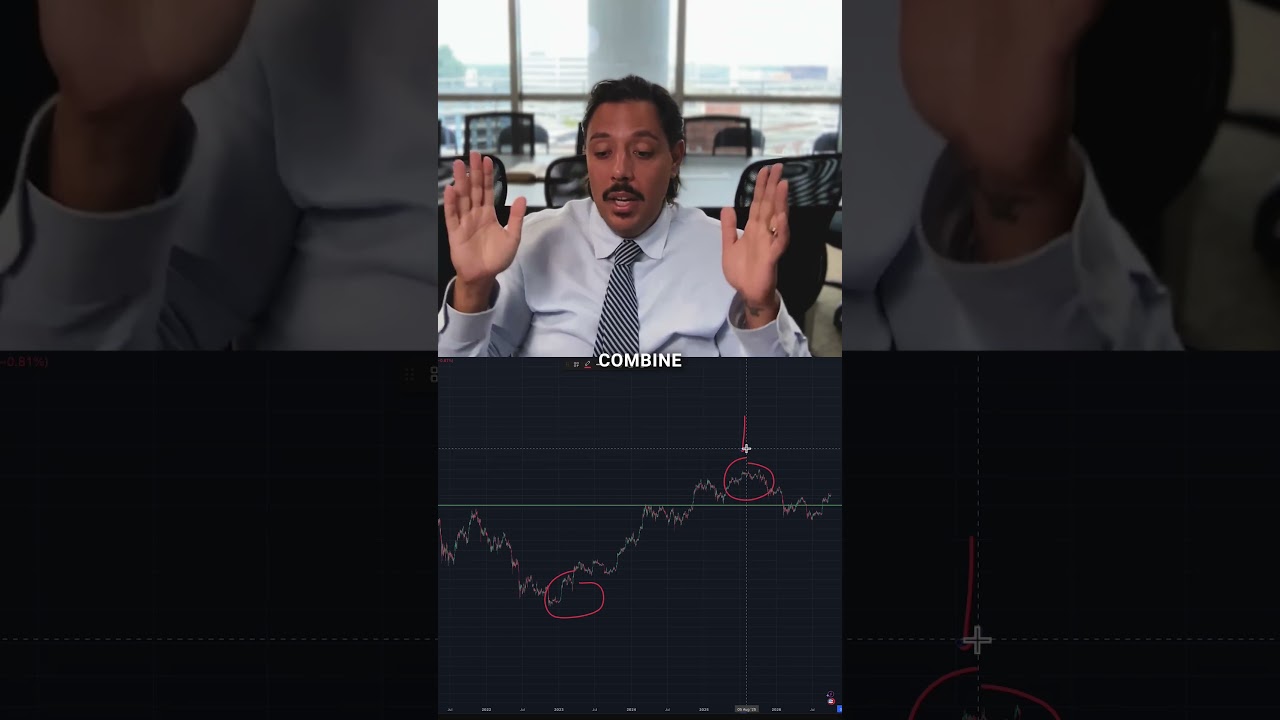
In this presentation, the speaker argues that the Clarity Act is irrelevant to cryptocurrency markets, emphasizing Bitcoin’s built‑in scarcity from its halving schedule as the primary price driver. To time investments, the speaker first seeks to locate the market bottom and then identify when upward momentum resumes. They analyze historical cycles by measuring the number of days from each cycle’s peak to its trough (164, 406, 364, 378 days) and feed these intervals into an ensemble of ten statistical forecasting models (implemented via Claude code). The ensemble’s average predicts the next bottom to occur around October 20, 2026. For momentum, the speaker applies moving‑average analysis to each cycle, again using ten statistical models and selecting the top three, which yields a momentum‑restart window from November 1, 2026 to February 6, 2027. The presenter believes the market is already at the bottom, expects a sideways‑to‑slight‑up move through November, and reiterates confidence in the methodology’s accuracy.
Chapters
The Clarity Act, it matters, but not for crypto. Crypto is different. It's its own beast. It's going to bull market with or without the Clarity Act. Every 10 to 15 minutes, there's a certain amount of Bitcoin that's paid to miners, and that gets cut in half automatically every 4 years or so. Now, the beauty of that is it builds into the asset class something called scarcity. Scarcity. And scarcity drives price up. So this asset class increases for that. So it's very accurate. It's better than anything else in my personal opinion for the predictability of the Bitcoin market and the crypto market as a whole. But the first step is to try to predict where the bottom is, okay? You'll see why I do that. The second step is to try to predict when the momentum actually kicks back in the market, right? So we don't want to buy the bottom per se, but we want to buy when the market's starting to go up again. Does that make sense? We want to, we want to get some momentum and price back. Step one is it takes the top from the bottom, the top from the bottom from every cycle, and it calculates how many days it took from for to go from the top to the bottom. As you can see here, the red, this one, this one, and this one, and this one as well. And here, right here is the actual days. Each cycle fall from top to bottom: 164 days, 406, 364, 378. And essentially what I did is I took 10 statistical models that statisticians use to try to predict the next number in the sequence with Claude code. So we took the average amount of days and the day that it's giving us is October 20th, 2026. So that's what, by time period, that's when the bottom is, which is literally in like a month and some change. So this green is where the momentum picked up. We use moving averages to pretty much find momentum in each cycle. As you can see right here, right here, and right here. And essentially what it does is it again uses 10 statistical models to try to predict the next number in the sequence. It uses the top 3 important statistical models and it gives us a number. And it's giving us a range of November 1st to February 6th, which is like what we have been saying for almost 10 months, correct? We've been saying it over and over again, beginning, end of this year, beginning of next year, end of this year, beginning of next year. Very simple. This predicts the bottom, but then it also predicts when momentum kicks back in the market. Does that make sense? If you ask me, I'm acting as if it is the bottom. I believe it is. I believe it is. And then I believe, uh, we'll just be trading sideways with a slight increase till like around November. That's what I'm moving on.