Stealth Bull Run: The Fed Awakens Altcoin Season

Alexander Lorenzo argues the Fed's recent policy shifts, including lower leverage ratios and rate cuts, are freeing up capital that will eventually fuel an altcoin bull run by late 2025 or 2026. He points to Ethereum's deep undervaluation against Bitcoin and novel liquidity metrics showing coiled potential energy. Lorenzo emphasizes patience and disciplined accumulation over leverage.
Chapters
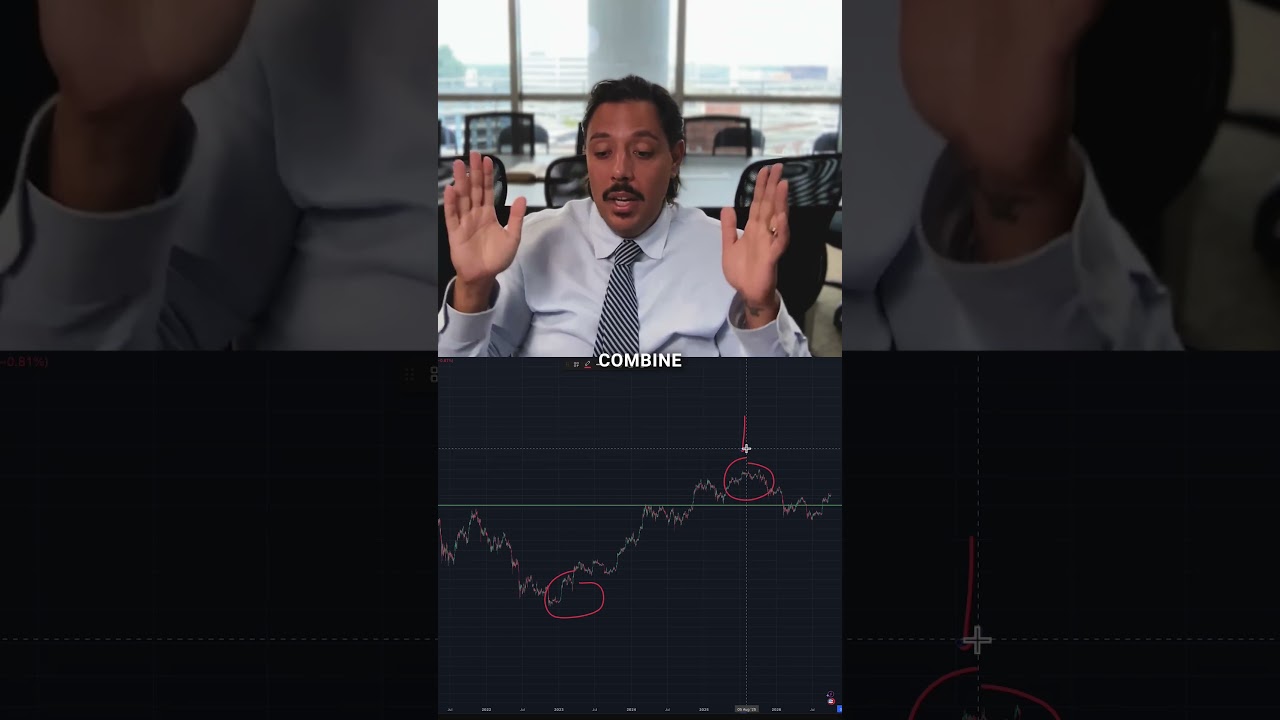
The Federal Reserve can be manufacturing an altcoin season right under everybody's nose. And the reason why I call it a stealth bull run is because nobody's talking about it. I don't know why, but there's this kind of policy shift they just made that could be injecting liquidity into all risk-on assets, including cryptocurrency and stocks. And this is exactly what I've been waiting for. We're seeing the early signs. It does not mean to go and take a loan on your house and buy meme coins. This just simply means I'm gonna give you the research before it happens, and please have patience. And if you're new here, my name is Alexander Lorenzo. I've been full-time crypto for 8 years. I've made millions of dollars off of crypto, lost millions of dollars off the crypto. Now I'm the owner of Coin Picks Capital, and I've made this YouTube channel as a way to connect with other investors. And according to my wife, I have the greatest mustache in all of the lands. Not the biggest mustache, but that doesn't mean great. I have an elegant mustache. And what I want to do is jump into the data. So I talked about this yesterday and it's kind of important. We're not seeing an altcoin season right now. We're seeing the manufacturing of an altcoin season. So I believe they will be injecting liquidity into the market. And I'm going to prove that in this video. But we recently saw a very, very quiet policy shift. They're talking about it, they're voting on it. So basically it's called the supplementary leverage ratio. I made a longer video on this yesterday, but this is the same tool that was used at the bottom of the COVID crash to inject liquidity behind the scenes. So they did a lot of things, but they dropped interest rates And they also changed the supplementary leverage ratio. Now, I want you to keep this in mind. Again, they didn't just do this. They also dropped interest rates to 0 to 0.25%, which I believe was the biggest reason for the liquidity injection. So we're not seeing like all-out money flying into the market. Relax. We're seeing early signs by these small policy shifts. And it's not even completely, you know, it's not even done. They're voting on it. So just relax. I'm just simply laying it out beforehand, which is obviously a good thing because this allows us to be first. So the supplementary leverage ratio, it forces banks to keep extra capital, okay, as a safety cushion, even if they're purchasing assets like US Treasuries. So if they purchase US Treasuries, they have to have extra capital to keep the bank safe so it doesn't default. Now what they're doing, and they're talking about it for the 5 biggest banks in America, they're saying, okay, we're gonna drop that ratio so you don't have to keep the cash. And what this is gonna allow them to do is take more risk by buying more US Treasuries. If they buy more US Treasuries, they're literally taking capital And they're throwing it into the market. And this usually affects risk-on assets like crypto and stocks. And this is what I'm trying to explain. They're in talks right now and they're voting on it. And it seems to be that the voting will end towards the end of August. I wanna be very clear so you understand timelines and you don't gamble your mom's inheritance today. Please relax, okay? I'm gonna give it to you ahead of the curve all the time. It doesn't mean right now. Now, again, the last time this happened, Ethereum went up 5,382%. That's like turning $1,000 into close to $55,000 in like a year or two. So obviously this is significant, but remember, I want to say it like 5 times so you guys really comprehend it. They also did many other things to inject liquidity into the market. They dropped interest rates, which is probably the most important part, down from whatever it was at to 0 to 0.25. So again, they're rolling out these mechanisms slowly but surely under everybody's noses because nobody's talking about this, right? They're doing these slow maneuvers. So get the vibes, okay? Don't trip, get the vibes. Just understand where this is coming from. Another thing that they're doing that again, I don't understand why nobody's talking about it. When they came out with their projections about 11 days ago on June 18th, they clearly explained that by the end of this year, they should be dropping interest rates to 3.9%. Right now it's at 4.25% to 4.5%. So that means likely within the next 4 FOMC meetings that we will have towards the end of the year, Maybe they cut interest rates by 0.25, 2 separate times. So this will also be a slow, gradual easing of liquidity into the market. So we're not seeing a whole bunch of money flying in. We're just seeing them change their posture a little bit. And so the whole point of this, when it comes to interest rates, for people that don't understand, when they drop the interest rates, that means that the cost to borrow money is cheaper. So they're slowly but surely making it cheaper over time to inject liquidity into the market. So by the SLR and by the interest rates, they are easing off and injecting liquidity slowly but surely. Okay. So just, we're seeing it ahead of the curve. Does that make sense? So before we go into these next charts, which are extremely important to understand the altcoin season, Two mechanisms: SLR, slowly dropping interest rates. This could mean bull run in the future. SLR is going to be towards the end of August, and interest rates are towards the end of the year. So it looks really, really bright for the end of the year. Not right now. Let's get into these charts now. Now everybody put your attention on this chart and understand it. Okay, so the blue line is Ethereum's price. Bitcoin's price is at the top right here, and then we have a ratio which is the green line. So let me scroll down and explain it to you. So this ETH/BTC ratio tracks how much Ethereum is worth compared to Bitcoin. So when the ratio is low, so when it's going down, that means that Ethereum is undervalued. Now when the ratio is going up that means Ethereum is overvalued. So right now what we've seen in this cycle is that Bitcoin has taken the show with the Bitcoin spot ETF, Bitcoin president. I mean, pretty much everything is Bitcoin, Bitcoin, Bitcoin, but we haven't really seen an altcoin season. Yes, we've seen some altcoins do well with Solana and Base about a year ago or whatever the case is, you know, towards the end of 2024, beginning of, you know, 2025. But We have not seen an altcoin season. For the people who are like, oh, the altcoin season is dead, it hasn't happened— no, that is not true. The problem is, is that we're not in a risk-on environment. We haven't seen the liquidity come into the market in general. So what I'm saying about the end of the year stuff, it's actually really, really, you know, important for altcoin seasons. Altcoins don't— they don't do well unless there's hype. And if there's no liquidity, there's no hype. If there's no liquidity, nobody wants to take risk. So this is a really, really good chart because it really shows how undervalued we are right now. This is a really good thing for altcoins. People always want altcoins to moon, but it's like as soon as the price goes up, all of the opportunity goes out the window. Right now you have an insane opportunity. Look at how, how undervalued it is. It's literally the same level. It's below the same level as right before. Look at this bull run. This is, this is the 2020 bull cycle. This is like crazy undervalued. Look at Ethereum, right? Look at Ethereum right here. Look at the green line. Insanely undervalued, guys. Listen to what I'm saying. This is the time you start thinking about accumulating altcoins, right? You don't accumulate altcoins when Ethereum is overvalued. And the reason why we look at Ethereum is because Ethereum is the primary altcoin. So it's like the signal for all the altcoins. Not only that, but you have to buy Ethereum to buy other altcoins. So an increase in Ethereum's price is also literal by the utility of it. The utility of Ethereum is to buy other altcoins most of the time, not all the time. But the main point I'm trying to explain is that Ethereum is vastly undervalued in comparison to Bitcoin. And we need liquidity from the Federal Reserve, for people to start thinking more risk-on. And when they start thinking more risk-on because of the liquidity, that means that Ethereum and altcoins will benefit the most from this. And right now it is very low. If you want like a guaranteed 3x, buy ETH. It's so obvious right now. It's so obvious. The best time to get active in crypto is when nobody is active in crypto, when everything's undervalued. If you notice, my energy is increasing Because I want to make money. I've realized that these moments right here is what makes me money, these moments. So I will continue to focus, focus on it because Ethereum is so undervalued. Look at how undervalued Ethereum is in comparison to Bitcoin right now. Let's look at the global liquidity system. So let's zoom out away from crypto. Let's look at all risk-on assets and the best representation of all risk-on assets is the S&P 500. Believe it or not, stocks are very similar when it comes to price increase to crypto. So stocks and crypto are both in the category of risk-on assets, especially altcoins. Bitcoin could be moving into the category of digital gold, so it could be a little bit in the precious metals category, right? Because we see that right now with Bitcoin's price doing well with the World War III scare and everything. But when it comes to Risk-on, generally crypto and stocks are in the same category and altcoins are probably closer to stocks. Risk-on basically means people are wanting to take risk, right? And usually the risk comes from when there's a lot of extra money into the system, meaning it's easier to take out loans, there's a lot of extra capital, and the Federal Reserve is injecting capital and liquidity into the system. Now, a good representation of global liquidity that a lot of people have been talking about is the M2 monetary supply. So there's the M0, there's the M1, and there's the M2. I'm not going to go into the details of it. You guys can Google search it or whatever the case is. But generally, the M2 is used to understand available liquidity into the system. Now, what I did is I took that same ratio that shows the undervalued or overvalued nature of the market And as you can see right here, when this ratio drops, that means that we are overvalued in relation to price. Okay. Listen to what I'm saying. So what that basically means is there's not that much liquidity and the price is high. Now in this period right here, there was a lot of liquidity and the price was low. I want you to think of liquidity like potential energy. Right? So there's a lot of cooped up energy, right? Right now, there's not a lot of cooped up energy, but in this period right here, there's a lot of cooped up energy and the energy hasn't been expressed in price yet, meaning the energy didn't flow into purchases for the stock market because we're looking at the S&P 500, right? So right now, there's not a lot of energy, but the prices are really high. So again, when I say not right now, I mean, not right now, but I see signs of that cooped up energy, the potential energy from the liquidity coming into the market. I see signs of them changing. So we do have a bright future. I've been talking about the extended cycle for cryptocurrency, like maybe it extends into 2026. And I do believe this will happen. I do believe that we will have an extended crypto cycle. We've never experienced this. This is the weirdest cycle we've ever had before in general, bro. Like everything— we have a Bitcoin ETF, Ethereum spot ETF. I mean, we have never seen more institutional demand. So I do believe we might, especially with altcoins, move a little bit away from the Bitcoin halving 4-year cycle that we've consistently experienced. And especially with altcoins, especially with altcoins, man. JP Morgan just launched their own stablecoin for institutional investors, right? Just think about that. JP Morgan was involved with the creation of the Federal Reserve, the most powerful entity, right, in the face of the planet. BlackRock, also one of the most powerful entities in the face of the planet, is putting marketing campaigns behind RWAs. So it's very clear that they're extending the cycle, but they're still investing and building within cryptocurrency. It's extremely clear. So yes, I believe with altcoins specifically, we could have an extended cycle and it could get a little bit away from Bitcoin. So it's not the end of the world. You will make money and you need to broaden your time horizon. For the people that want to make money today, I'm sorry to poop on your parade, but that's not how money's made. That is not how money's made. Money is made over patience and diligence over a long period of time. not with haste. If you make— the Bible talks about this— if you make money with haste, it will fall just as quick. So right now, it's smart people in your brain, catch this: take your time, understand crypto on a level you never have before, and when the Federal Reserve starts injecting liquidity slowly but surely into the market, you will be prepared to take advantage of altcoins On a level you've never taken advantage of it before. Now catch this, watch, it's gonna blow your mind. Ready? Last cycle, the top 10 altcoins by percentage increase increased by 500,000%, bro. That's like millions of dollars from $1,000. I don't even know the exact math. So yes, you could turn $1,000 into millions. I've seen it happen before, right? And this happens according to the 4-year cycle only like every 3 to 5 years. So you have now a lot of time to sit here, research, learn. So when the market does come into play, you're ready. You're ready. By the way, hedge fund managers brag about returning 15 to 20% a year. If you get 100x, right, or one even 10x, bro, one 5x, if you 5x your portfolio, if you 3x your portfolio, You will make more money than like five to ten years of hedge fund returns. So yes, it's worth your patience. Trust me. Be patient. Relax. Don't move in haste. Don't blow your trading account, and try to act like a professional for a second. Okay? So we're going to extend our time horizon to the future, but it doesn't mean you stop working now. You still put in the work. You stop making excuses. And let me show you this other chart that's also even more interesting than this chart right here. You've probably. If you've never seen this before on the internet, please don't copyright this chart. Don't screenshot this, please. I mean, you can screenshot it for yourself, but don't start sharing this chart. So what we're looking at is the M0 plus debt. So I took all the money. I said, forget it. You know what? Let's stop trying to make this complicated. Let's take all of the money that the Federal Reserve, their monetary base, like literally every dollar, taking into consideration what the Federal Reserve does. And then let's take all of the debt, everything. Let's make a ratio, a normalized price out of that, and let's compare that to the S&P 500, and then let's create our ratio to see if we're overvalued or undervalued. Okay, so when this ratio rises, it means that liquidity and debt— a lot of people are only taking consideration liquidity. I see it all over the internet: M2 money supply, global liquidity, global liquidity, most popular chart on the internet. But no one's taking into consideration debt. And see, the thing about debt, which people don't understand, is that it creates 89% of all of the liquidity in all of the financial markets. So you're missing 89% of this expansion. You're missing a lot of the data. So we took into consideration literally everything. All right? Everything. And this gives us a better picture than the last chart. So we're looking at, again, M0 plus debt divided by the S&P 500 to give us a ratio. And when this ratio rises means that basically liquidity and debt are growing faster than the market prices. If liquidity and debt is growing fast and the market prices are not reflecting, that means the potential energy of the market to go up is going up, but the prices are not reflecting, AKA undervalued. Now, if it's going down, right? This means right here, when it falls, it means market prices are outpacing monetary expansion, potential overvaluation. So our goal as investors and traders is to buy when it's undervalued. So what we want to see is liquidity and debt expanding and prices not reflecting on the chart. That's the best buy opportunities. And so when we look at it from this perspective, look at this perspective, this perspective looks horrible. But when we look at the debt perspective, it's not that bad. Yes, we are on a downtrend, But look at the ratio. We're like right in the middle. And if you look, for example, look at the years right here. This is 2000, 2005. This is 2010. We you know that there's been a massive bull run, right? Look at this. This is 2020. We had the greatest asset prices that we have ever seen in crypto in 2017, which was right around here and right around here. So we're at that level. It's not all doom and gloom. We probably just need to see this reverse a little bit. If we see it reverse a little bit, then maybe we might see, you know, the prices reflect or whatever the case is and people take more risk. But in general, what I'm explaining is it's not that bad. Like, it's not mayhem, mayday. And the Federal Reserve is definitely lowering or decreasing interest rates. And, you know, they're putting in these little mechanisms that will increase the liquidity and debt. Now, there's all these interconnecting parts, and I'm sure we'll dive more into other videos and the variables so you guys really understand what's going on. But that's why I picked the biggest charts, because the thing is, everybody claims to understand the interconnecting parts of the Federal Reserve, but nobody can give accurate explanations. I see it all over the internet. Everybody claims, I can understand exactly how the liquidity is going to go into here based off of what I learned. Bro, it's limited. You don't know what the Federal Reserve is going to do. You don't. You don't know what mechanism they're gonna do. One cycle they use interest rates, another cycle they use something else, another cycle they use quantitative easing. There's all these different ways that the Federal Reserve can inject liquidity into the market. There's a lot of different ways. So instead of trying to specifically find one thing, we have to zoom out, look at everything as a whole, and this will give us the most accurate data in my opinion. That's my, that's my, um, thesis with this theory is like, that's what will give us the most accurate data. If we could just look at everything at once on one chart and then determine trends from there, it will be clean data. It will be clean. A lot of people zoom too far in and they're looking at only one perspective of the show. It's like, it's like, uh, the best way I can explain it, it's like when someone's having a conversation and they're like, um, they say something, right? And it sounds really bad. If you take whatever they say and you write it down and you give it to somebody else they might interpret it completely different from what the person actually said in real reality, right? There's context and situations. There's a lot of context and different variables. So when you look at one chart, for example, M2 money supply, you're looking at one variable of an entire elaborate system, right? You're looking— you're trying to zoom in on like one little specific thing with excluding all the other mechanisms they use to inject liquidity into the market. Right? So this is why I looked at everything, and we're going to be diving deeper into this chart. We're going to be getting way more detailed, specifically with the MO and total debt. And I just want to get really good at this and really understand it because I believe it gives us an accurate representation of what the Federal Reserve could do. And then what I also want to do in future videos is I want to relate this chart to public perception. So we want— I believe, look, this is what I've always said, the Federal Reserve is more of like a PR company than they are like a bank. Why? Because their goal is just to make people happy. If you look at the end goal of what the Federal Reserve does, they just want people to not freak out. Because if people freak out, then they start withdrawing their money from banks. If they start withdrawing their money from banks, it starts constricting the liquidity, and then they have to do something. They have to increase inflation. They have to do something to bail the banks out. So what they want to do is make sure everybody's happy and calm. They want people to not panic. I know they say, and this is one of the metrics they use, is unemployment. They specifically use unemployment because if unemployment rises, then the public people are going to freak out. If inflation rises, then the public people are going to freak out. So I believe they're like a PR company, but they also have control over money. But they're— you could see it with the Federal Reserve. They're constantly trying to keep people calm, keep people calm, keep people calm, right? Especially, you know, we see right now the President of the United States is exposing Jerome Powell and they're going back and forth because he's pissed off about this, that, and the third. You get the point. The point is, is that public perception is important. So we can actually see that data with search volume. And this is called narrative economics. So what we're going to be building is models to look at public perception, hype, media in comparison to these liquidity models. Because I believe the 3 variables, the most important variables is liquidity, Demand. Actually, I'm talking about altcoin. It's liquidity, team, and demand. But if we're looking in the context of just prices in general, it's just liquidity and demand, liquidity and demand, liquidity and demand. A lot of people say supply versus demand. They don't understand what supply means. It's really liquidity versus demand, right? So the same metric that I'm using to understand the undervalued nature of an altcoin is the same thing I'm going to be using for the Federal Reserve and our entire monetary system. And I think it will help a lot. It will help a lot of people get long-term clarity and stop freaking out about the market and, you know, just lower the amount of haste that's in the market. But that's pretty much it for this video, guys. Thank you so much for watching my channel. If you're new here, subscribe to the channel. Thank you, guys. I'll see you later. Peace out. Catch you in the next video.