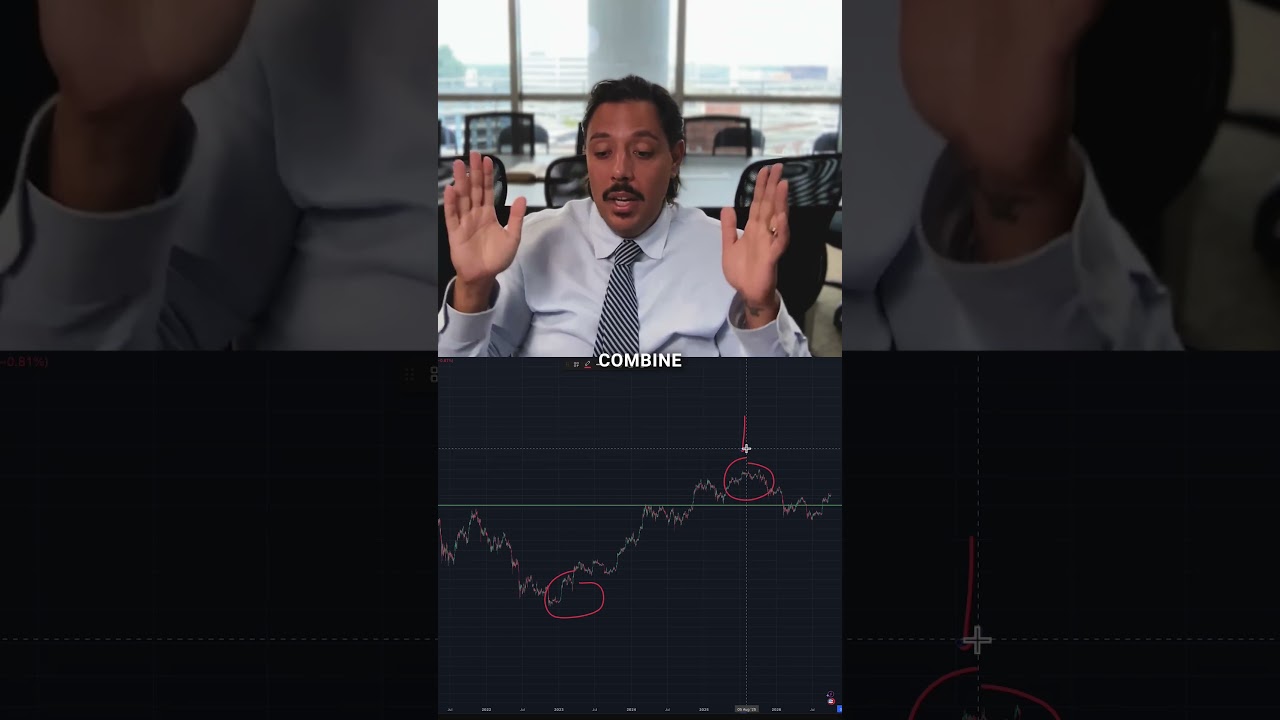
In this presentation, Alexander Lorenzo explains an AI‑generated “bottom blueprint” that forecasts the next Bitcoin market bottom for October 20 2026 and the subsequent momentum return on November 23 2026. He walks through the methodology: measuring the number of days between historical Bitcoin tops and bottoms, feeding those intervals into ten statistical models across many tokens, and selecting the three most historically accurate models. The averaged output defines a prediction window of September 19 – November 16 2026, with a most‑likely bottom around October 20. Lorenzo validates the approach by citing a prior successful prediction of a Bitcoin top, which led him to sell roughly 80 % of his portfolio (including a large Zora position) and capture gains. He stresses that while the model shows credibility, investors must understand the process and make their own decisions rather than blindly follow AI outputs.
Chapters
The last time we did this, it called the top. This is called the bottom blueprint. It was fully created and automated by AI. And it's predicting that the next bottom is October 20th. You need to understand the methodologies exactly how, so you can, you know, really comprehend it. You don't just blindly move with AI, right? You want to understand the process. We're going to go over that. Not only that, but it shows specifically when the momentum returns, November 23rd, 2026. Now what's really cool about this, is I also break down specifically the exact types of coins that worked around these periods previous cycles. How did we find the bottom date? All I did, it's actually very simple, is we took the top— so you see the red dot there— and the bottoms for every single cycle, and we figured out the exact amount of days that it took from Bitcoin from the top all the way to the bottom. And now all you have to do is predict the next number in the sequence. And so we ran it through 10 statistical models with a whole bunch of tokens, and essentially it came up with these 10 values. Then I told it to essentially pick the most accurate according to the history. It picked these 3 right here, and we averaged it out, and it gave us a pretty much an average of September 19th, uh, not an average but a window from September 19th To November 16th, and it says most likely around October 20th, 2026. Now the reason why I think this is accurate is because they accurately predicted the top. If you guys look at my community, I have a sell call. I have a sell call where I got rid of almost 80% of my portfolio. I think it was a little bit more than that because I was holding a lot of Zora. Made a whole bunch of money off the token Zora. Then I went and ran this exact statistical model to try to figure out the top of Bitcoin. We did it in a live Q&A, and then I sold all of my Zora, like 80% of my portfolio at that time, made money, and then yes, we went down from there. So we were about 10 days off the last time we did this. Again, the last time we did this, it called the top. Now I'm not gonna say it's calling— at the end of the day, you gotta make your own decision. I'm not gonna say it's gonna call the bottom perfectly, but I will say that I think that there's some credibility that's backing up this number.