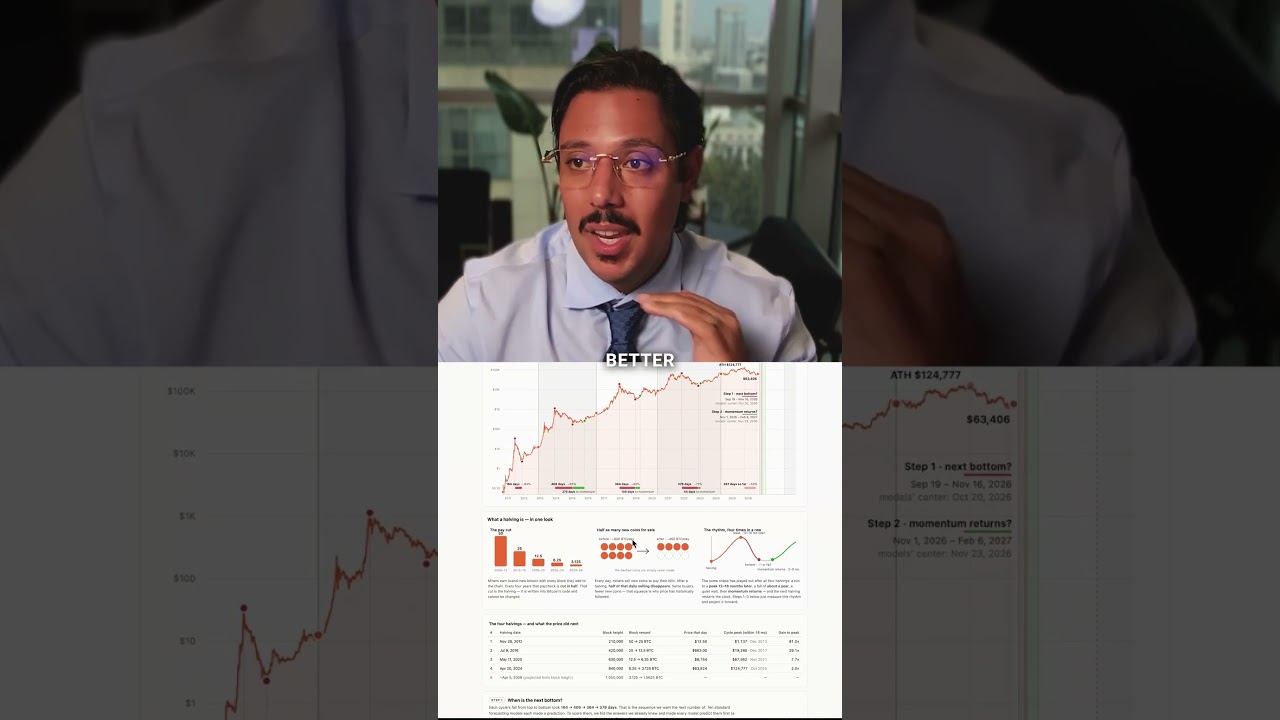
Bitcoin's halving mechanism creates scarcity that drives price cycles. Using historical data from four previous cycles, the presenter averaged ten statistical models to predict the next bottom around October 20, 2026, and argues the market has likely already bottomed.
Chapters
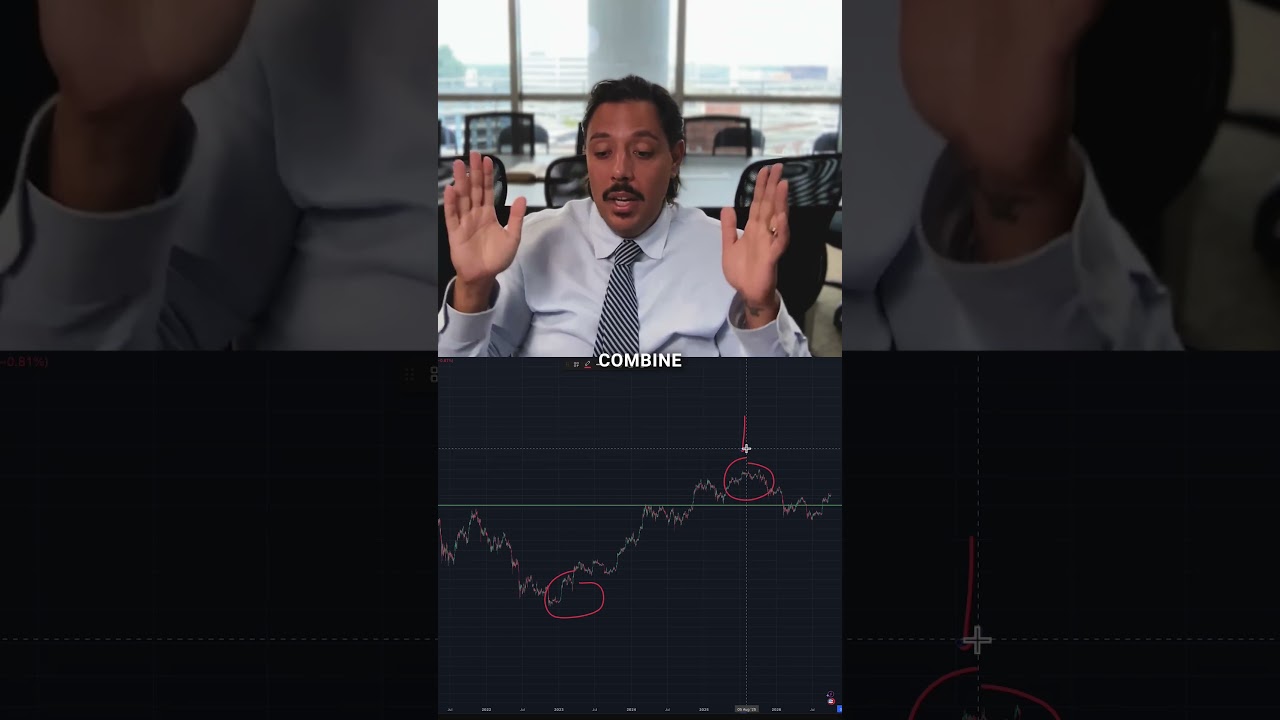
I think we have already bottomed. This is my personal opinion. I think we're going to trade sideways until October. So the Bitcoin halving is essentially a mechanism built into Bitcoin that cuts its issuance in half roughly every 4 years. Now, the beauty of that is it builds into the asset class something called scarcity, and scarcity drives price up. So as you can see, every time we have a halving, there's typically a big bull market and then the market falls. Now we have all of these theories and all these great things, and I got humbled by this. And I've heard every single story about why the market goes up and really good reasons and really good YouTube videos that do 200,000, 300,000 views. And they all have some truth to it. But I've come to a conclusion that this is the most consistent. It is the most consistent variable. There's nothing like it that exists in the natural world, which is scarcity and finite supply. So this asset class increases for that. So it's very accurate. It's better than anything else, in my personal opinion, for the predictability of the Bitcoin market and the crypto market as a whole. And so the beauty of that is now you can make some predictions. It's basically how we called the top in a live Q&A last October. Step 1 is it takes the top from the bottom, the top from the bottom from every cycle, and it calculates how many days it took from— to go from the top to the bottom. As you can see here, the red, this one. This one and this one and this one as well. And here, right here, is the actual days each cycle fall from top to bottom: 164 days, 406, 364, 378. And essentially what I did is I took 10 statistical models, um, that statisticians use to try to predict the next number in the sequence with Claude code. So we took the average amount of days, and the day that it's giving us is October 20th, 2026. Um, so that's what— by time period, that's when the bottom is, which is literally in like a month and some change. So in a month or some change, according to history, we should see a bottom. Now I don't think we're going to see an extra drop. I think we're going to trade sideways until October. I think we have already bottomed in my— this is my personal opinion.