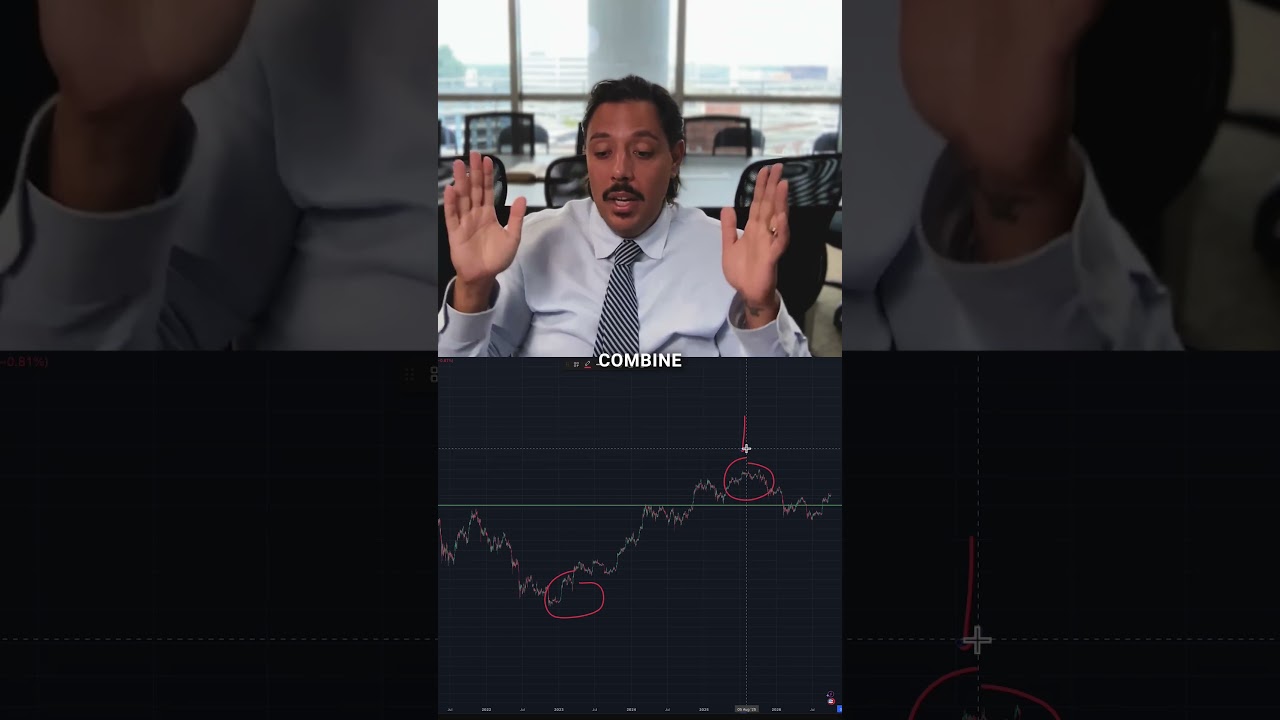
What WWIII Means for Bitcoin, Ethereum, and the Entire Market

This content was created by Alexander Lorenzo. This content was uploaded by Alexander Lorenzo. This is a YouTube video titled "What WWIII Means for Bitcoin, Ethereum, and the Entire Market" (published/edited 2025-06-20). A single presenter (monologue) analyzes how spikes in "World War III" search interest and shifts in the federal funds rate correlate with risk-on asset moves (S&P 500, Bitcoin, Ethereum), argues panic drove the February 2022 market drop, and explains implications for crypto trading. The speaker outlines a 1–6 month plan: stay patient, build a researched cryptocurrency database, evaluate projects by liquidity/team/demand, watch for Bitcoin momentum and an eventual altcoin season, and notes alternative bullish dynamics such as "shadow quantitative easing" via stablecoin liquidity.
Chapters
What does a potential World War III mean for cryptocurrency, Bitcoin, and Ethereum? So what we're looking at is all the implications around this topic. As you can see right here, World War III search term topic on Google Trends is spiking. This is the biggest spike we've seen in the past 5 years. And the last time this happened, well, there was implications on the stock market and crypto. We're gonna be looking into that, seeing how we can make money off of it to make a level-headed investment approach. To be clear with you, this is not a political video. I think all war is evil. I think both sides are probably wrong because that's where death is birthed, and I'm not going to be talking about that. Simply just looking at the markets to make money because that's what I do. So there's 2 things you have to know when we're looking at the actual charts. The first thing is the S&P 500, which is a list of the 500 biggest important companies in America. Basically, there's all these different companies They put them into a basket and they give you one number, and it kind of shows the health of the economy when it comes to risk-on. Now, the second definition that you have to understand is a risk-on asset, which is an investment that tends to perform well when investors have a high appetite for risk, such as stocks or crypto. So crypto and stocks are closely related, being that they're both in this kind of category of risk-on assets. So basically, when someone's looking to buy a crypto or a stock from all levels of investors, they're looking to take more risk on because there's more risk associated with something like a cryptocurrency or a stock than there is, for example, a house or gold. There's a lot less risk in houses and gold prices, right? Because they've been out for longer, and then houses have a cash flow element attached to it. So what we're looking at, just to kind of bring it full circle for you, is the S&P 500 and how war— the search term volume for World War III in the past— how that affected the risk-on asset of, you know, the stock market. And this is super important, and we're going to relate it to crypto as well, but just pay attention. So there's only 3 events in modern history when it comes to asset prices where we had a major fall. This one was a 50% drop. This was in the year 2000. This one right here was in 2008, the 2008 housing market crash. And this one right here specifically was COVID, as you guys know, in 2020. Now, we had this weird fall over here. The reason why I call it weird is because this is the only drop we've had in modern history after the year 2000. And I specifically like to look at the data with the internet because obviously information consumption completely changed. when the internet arose around the year, you know, 1990, 2000 era, right? So this was the weirdest one because in this case, this is the only situation we had where interest rates remained very similar. Let me show you what I'm talking about. So what we're gonna do now is we're actually gonna compare the federal funds rate to the S&P 500 and crypto. So the federal funds rate is the interest rates that banks charge each other to borrow money overnight, and it helps set the cost of borrowing for everyone. So if it's expensive to borrow, there's going to be less borrowing. And if it's cheap to borrow, then a lot of people are going to take out loans on houses and cars and things like that. And this is kind of like what stimulates the economy. And contrary to what a lot of people have been saying online, I don't know if you guys knew this, but 89% of all of the money in the M2 money supply comes from credit, not from quantitative easing. This is a misconception that a lot of people do not understand. It comes from credit. So interest rate is a leading indicator. The M2 money supply is a lagging indicator. If you're looking at the M2 money supply, you're late. The leading indicator is lower interest rates. Lower interest rates stimulate the economy. So we have 3 events where interest rate policy shifts led to a catastrophic market fall down. And there's a 4th event that's super random in 2022 that did not happen because of an interest rate change. So what led to that market turndown? And as you can, you know, understand from the beginning of the video, you probably noticed, well, there was a spike in World War III search term. Let me show you what I'm talking about. So I zoomed out a little bit for you. The bottom here is the federal funds rate. And as you can see, the tops of the markets correlate almost perfectly To when they started dropping interest rates. Right here, interest rate was at about 6%. As you can see over here on the right, look at 6%, and then they started dropping, and it's like topped the market out. Same thing over here, interest rates were at 5%. They started dropping interest rates, making the cost of borrowing money cheaper. And I've made other videos on this that went into more detail. But as you can see, this topped the market. Same thing over here. It wasn't perfect, but around COVID, they started dropping interest rates, and then shortly after, we had our COVID event that we zoomed in on before. But look at over here. For some reason, interest rates were increasing, but the market topped out. Why? What is going on with this specific period of time here? Why did the market drop 27% and interest rates were increasing contrary to what we've seen all the way since 2000 in the modern era with the internet? And my best theory, as you can see right here, is because, as you can see, search interest for World War III. Look, this is the World War III topic. This is Google search terms. So people are typing in World War III. People are very interested in what's going on. As you can see right there, February of 2022. I want you to remember that date 'cause it lines up almost perfectly to this weird event that we have over here that I've been talking about. Look at this right here. Look, January, February, and the entire market drops. So it seems like a lot of people are looking up the search term World War III. Now, is it World War III that caused the market to fall? Probably not, 'cause we didn't have a World War III. But what it really was, it was panic and fear. Panic and fear. This is a psychological game, guys. You have to understand this. A whole bunch of people started freaking out and they sold their risk-on assets, because remember, these are risk-on assets. They sold their risk-on to go risk-off because they thought there was gonna be a World War III, and this World War III kind of like virality instilled panic and fear into them. People sell when there's fear. Now what's interesting about our current situation is not only do we have this kind of massive spike that we've never seen in the past 5 years when it comes to World War III topic, you know, with Iran and this whole entire war going on, not only do we have that, but we also have this decrease in interest rates. So we have kind of like 2 checkboxes The decreasing of interest rates that caused the crash 3 separate times before, but we also have the spike of World War III search term. Like, just think about that. We have 2 checkboxes. It's not really looking good for cryptocurrency specifically, but it does not mean you cannot make money. A consistent trader is the best type of trader, and to be honest with you, this is an opportunity. To me, it's like a slingshot. As the market drops, the potential for you to make money increases. Think about this, because the prices are becoming cheaper and there's gonna be a bottom. As the market rises, the potential for you to make money decreases because the prices are more expensive and the chance for it to fall is higher. So you should be looking for the market to go down to either buy it cheaper, or you could even place a bet that the market's going to go down by shorting the market. This is All common things that you should adopt in your trading strategy to become a consistent long-term trader. A lot of people are one-hit wonders. They find a meme coin, they find an altcoin, they get a 20x, they get prideful, and they can never replicate it again. They stay very inconsistent and they have to get the job again, right? They have to go get their job because they made a whole bunch of money, but then they lost it all because they weren't consistent, right? Now there's obviously a lot of context missing. In this case, we're only looking at one perspective, which is the war. Now there's a whole bunch of other perspectives And for example, right here, this is a very bullish perspective. It's called shadow quantitative easing, where stablecoins are injecting a new type of liquidity that we have never seen before inside of risk-on markets. And they're buying debt and all these crazy new mechanisms that have been created with crypto. Again, we have never seen this before in the history of all finance. And I have a full video, it's about an hour and 20 minutes. You guys can go watch it in my communities. At coinpixedu.com. Go ahead and check it out. And yeah, that will kind of lay out some bullish cases, and we'll make some more videos in the future. But the point is, you have to look at both sides of scenario, not just bullish, not just bearish, both sides, and make a decision. So let me lay out my plan for the next month to 3 months to 6 months. What am I thinking and what am I looking for? And if you feel that, you should definitely take notes. Number 1, I'm staying patient and I'm building a cryptocurrency database. We have a specific database We essentially research almost every single coin before we buy. It's not perfect, but we like to put in anywhere from 30 to 50 hours. Usually we'll put in like a good like 2 to 3 hours. We have specific criteria we look for, and then we start easing in. And as the hours increase and we verify what the project is doing, then we size in more with more capital so we can just really understand the project. But what I'm doing is I'm looking for 3 different metrics, and we've talked about this in other videos: liquidity, team, and demand. We're just going to develop a massive database of all of the greatest, you know, coins within a specific ecosystem. When we buy a coin in an ecosystem, we look at every coin in the ecosystem. This is where people make a big mistake. You have to compare and contrast the coins. It's called fundamental analysis, like stats on a football team, right? You don't bet on a player unless you look at all the other players in the same category to see who's the best or who's the most undervalued. That's what you're supposed to look for. So step 1, I'm going to be staying patient and I'm going to be researching altcoins like a madman. Number 2, I'm looking for momentum in Bitcoin. Altcoins do not fly without hype. We need hype for altcoins to do well. Since the beginning of altcoin history, they have all done well with hype. And so the hype starts off with Bitcoin momentum. We see Bitcoin go parabolic, there's a lot of hype, and then people start thinking about the next thing, and then they start buying into altcoins. And this is where we have Bitcoin momentum And then we also at the same exact time see Bitcoin dominance drop. Let me show you. Here's one of the charts that we use, and as you can see over here, this is 1-year cumulative buy-sell quote volume difference for altcoins excluding Bitcoin and Ethereum. So basically what it's looking at is all the buy orders and all the sell orders and the periods of time when there's more buy orders than sell orders, and it's specifically looking at everything but Bitcoin, Ethereum, aka altcoins. So as you can see, this is Bitcoin's price rising as you can see, there's a little peak here. This is like the altcoin season. So we need Bitcoin momentum. The liquidity shifts from Bitcoin, as you can see the curvature effect, all that liquidity flies into altcoin. We see exactly the same thing play out in recent history about a year ago. Again, same thing, Bitcoin's price moving up in momentum. And then as you can see right here, more buys than sells on the altcoins. Again, same thing play out. So we need that to happen again. And I, just to be clear with you guys, I don't believe that this was an official altcoin season at all. It's not showing the characteristics of it. And there's many other charts that prove that, but let me show you the Bitcoin dominance and what I'm saying. So the top chart here is Bitcoin's price. And the bottom chart is the Bitcoin dominance chart. As you can see, we had a lot of momentum in Bitcoin's price. And then eventually the Bitcoin dominance dropped. The liquidity moved into altcoins, AKA altcoin season. Again, same thing happened over here. We can see a lot of momentum in Bitcoin's price. There's a pretty big price increase. And then look, Bitcoin dominance dropped. We have not experienced that this cycle. So that means number one, we need Bitcoin momentum, which leads to hype. Number 2, altcoin season has not happened. People that are saying it's dead do not know what they're talking about. Okay. And number 3, the opportunity is still there and I will take advantage of it. I will be ready while people are panicking.