In this video Austin Klar, a lawyer‑turned‑real‑estate agent and developer, provides a data‑driven market update for San Francisco single‑family homes in November 2023. He explains that inventory has continued to shrink year‑over‑year, with new pending contracts (escrows) outpacing new listings, driving monthly supply down from 2.2 months in October to 1.5 months in November. Demand remains strong relative to the limited supply, as shown by rising absorption rates and homes selling in about 30 days, typically at or near list price. Comparing current metrics to the 2008 post‑recession period highlights a much tighter market today. Price analysis shows median and average sale prices, as well as price‑per‑square‑foot, have softened slightly month‑over‑month but remain higher than the same months last year, indicating no price crash in 2023. Seasonal holiday effects have caused modest softening, but Klar predicts prices will stay elevated into 2024, especially if mortgage rates continue to decline. He concludes with a personal call to action, offering his direct assistance to prospective buyers or sellers and encouraging viewers to subscribe to his channel.
Chapters
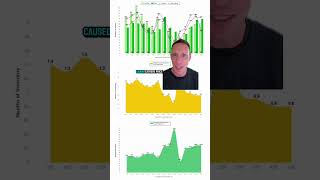
Inventory is down year over year, prices are stable, and demand for single-family homes in San Francisco is rising. And I expect that trend to continue into the new year, especially if mortgage rates continue to fall. In this video, I give you a full breakdown of what happened in the single-family home market in San Francisco in November of 2023. What's up everyone, this is Austin Klar, your lawyer turned real estate agent and real estate developer in San Francisco and Marin County. I've been a Bay Area resident for over a decade, giving me in-depth firsthand knowledge of what it's like to live and work here. If you're thinking about relocating or want more information about the market, definitely reach out to me. My contact info is in the description below. I will personally I personally answer every call, every email, every text, and I'd be more than happy to help you. And if you like videos just like this, please subscribe to my channel and don't forget to click the bell so you're alerted every single time I post a video. All right. So this video is all about what happened in the single-family home market in San Francisco in November of 2023. So every time I do one of these videos, I'm going to start out by discussing what is going on with the overall supply of inventory for the particular category. So in this case, single-family homes in San Francisco.. And as you can see in November, the red line, new escrows, so new pending contracts is outpacing the number of new listings. Same thing with the number of homes that are actually selling, outpacing the number of homes that are coming onto market as new. And as a result of that, inventory is shrinking. And this is typical for the holiday season. Typically you have a bump after Labor Day, which, you know, we saw again this year, and then it sort of falls off heading toward the holiday. And, you know, we don't have December's data yet. We're still in the middle of December., but you should expect it to be, you know, lower than what we're seeing here in November. And that's certainly the case that we saw last year. So right now, overall inventory on net is shrinking, not rising. And that's really important to understand when you're trying to predict what's going to happen with home prices. If, you know, everything comes back to supply and demand. So if demand is stable, you're going to need inventory to rise in order to have downward price movement. On the opposite end, you're going— if supply is relatively steady, or it's falling, then you need demand to fall more than the supply is falling in order for prices to come down. And we'll take a look at the demand side of this, a few different metrics of the demand side of the equation in a second. But one thing to think about as a measure of demand is, you know, how many homes are getting into contract in relation to the number of homes that are actually on the market. And I want to go back and compare, you know, what this picture looks like, to what it looked like in '08 and after the Great Recession, because the two, you know, pictures could not be more different from each other. All right, so this is the same data, new listings, pendings, homes sold, and for sale on a quarterly basis going all the way back to '08 and through November. Inventory under 300 homes on the market right now, uh, with pending transactions a little bit under 200. If you go back to '08, right? Mm-hmm. These lines right here, you can see how much more inventory there was active on the market, almost 850, you know, single-family homes in September, 750 in October, 775, give or take, in November, compared to, you know, 3 times less than that right now. And if you look at where new escrows are, so a way to measure demand is, you know, how many homes are actually getting into contract and how does that relate to the overall number of homes on the market, you can see that about the same number of homes were getting into contract today as it was back then, except as a proportion of the overall inventory, it's significantly higher. And you can see that play out with when we look at monthly supply, when we look at absorption rate. So let's do that right now. All right. This graph shows the monthly inventory or monthly supply based on closed sales. In other words, if no new homes came to market, so the only inventory that existed is what exists on the market right now. Based on current demand and how quickly homes are selling, how fast would it take to sell out of all existing homes? And what you can see is that month over month, the monthly supply actually fell from 2.2 months in October to 1.5 months in November. And what that means is there was a greater proportion of buyers in November compared to the overall number of homes on the market than there was in October. And same thing since November— since September. So since September, On average, there's been higher demand with lower supply. And you can see that play out with the absorption rate. Basically, new homes coming to market every month, what percentage of them are actually getting into contract and closing? Well, it's gone up over the past 3 months. So it's not necessarily that there are more buyers out there looking. It's that there are more buyers compared to the amount of supply that is actually available. And it's that supply-demand dynamic that is really important if you're trying to make predictions about what's going on with prices. You need demand to be lower and supply to be higher in relation to each other for prices to come down. And that's not what we're seeing right now. And you can see that supply-demand dynamic play out. Looking at a couple other statistics, days on market, they are up October to November, but homes on average still selling in 30 days, which is very fast, faster than it was last year. You can also see the supply-demand dynamic play out with how much homes sell above their original list price. So down from October, but homes are still selling on average for their list price. So there are homes selling above list, there are homes selling below list, but on average they're selling for about their list price. And that's a function of the relatively high demand in relation to the existing supply that's on the market right now. Now, because there are overall less buyers out there, you know, typically closer to the holidays, you tend to see some price softening in the lead up to the holiday season. And that's what we saw saw this month. So, uh, median price of single-family homes, SF, went down from $1.65 million in October to $1.53 million about in November. Average price, $2.3 million down to $1.985 million. Um, but I think what is most interesting about these statistics is how October, November of this year compared to October and November of last year. Median prices down very slightly in October, up very slightly in November. Average prices up, I'd say pretty significantly. October 2.3 versus 2.075, 1.985 in November versus 1.891. So if you were, you know, banking on some sort of price crash in San Francisco for single-family homes in 2023, it hasn't happened. And you can see the same thing play out on a per square foot basis. Prices on a per square foot basis on average softened as well from $1,055 a foot in October to $976 a foot foot November, but both of these metrics up from the same time last year, $1,049 in October, uh, $942 in November. So, uh, there wasn't a price crash on an average per-foot basis. There wasn't a price crash on an average sale price basis or a median sale price basis. And that's really a function of what we talked about earlier, which is the relationship between supply and demand. Bottom line, there aren't that many homes on the market right now, and there are more than enough buyers out there, even with higher interest rates,— even with how high home prices are— competing for those homes, and that is keeping prices elevated. And I predict that's going to continue into 2024, especially if interest rates continue to fall like they have over the past 6 or 7 weeks. Well, there you have it. That's what happened in the single-family home market in San Francisco in November of 2023. If you're thinking about relocating or want more information about the market, definitely reach out to me. My contact information is in the description below. I will personally answer every call. Every email, every text, and I'd be more than happy to help you. And if you like videos just like this, please subscribe to my channel and don't forget to click the bell so you're alerted every single time I post a video.